An Overview of Arizona Public Schools:
By: Zachary Marchese, Bowdoin College 2025
Contact the author: [email protected]
Date published: 5/9/2022
Known for its desert climate and exquisite natural landmarks, Arizona (AZ) is home to nearly 7.4 million people. Arizona was founded in 1912, as the 48th state of the United States of America.
Arizona possesses a wide range of public schooling options, including public schools, private schools, and charter schools. With a longstanding history of conservatism dominating the political timeline and landscape of Arizona, charter schools were first introduced in June 1994, to provide families and students with greater flexibility and freedom within public education. Fastforward to today, nearly 1 in 5 public school students in AZ attend one of the 601 public charter schools. That is nearly 222,200 students attending charter schools in the 1,111,000 public school students in the state. This statistic awards AZ with the largest share of charter school enrollment relative to overall public-school population in the country. In addition, there are around 2,666 private schools (over 50% of them being Catholic or Christian) in Arizona teaching 65,899 students, ranging from pre-k to high school.
While the Grand Canyon State boasts a vast menu of schooling options, Arizona consistently ranks among the worst 5 states in the United States for the quality of their public education, on nearly every ranking, and is commonly referred to as the worst public school system in America. Source: (Hanson).
Read on for a more in-depth analysis of Arizona’s school systems, and Arizona’s schools’ strengths, weaknesses, and conclusions.
Arizona Public School Demographics:
Arizona is a very diverse state. The public-school student body population consists of:
- 4% Native American
- 2% Asian or Pacific Islander
- 45% Hispanic
- 5% Black
- 37% White
- 3% Two or more races
- 7% of students are learning English
- 46% of students come from low-income families
Sources: (McFarland, 44, 66, 86) and (“Arizona Schools”).
Graduation Rates:
In the class of 2019 high school AZ graduates, 88.8% of public non-charter school students graduated. On the other hand, only 48.7% of charter school class of 2019 students graduated, displaying an enormous disparity.
On a similar note, of the class of 2019 online school students, a mere 49.7% achieved their high school diploma. Source: (“High School Graduation Rates”).
Graduation rate by demographic:

It is visibly clear that Arizona public schools produce lower graduation rates, in nearly every demographic, than the national averages.
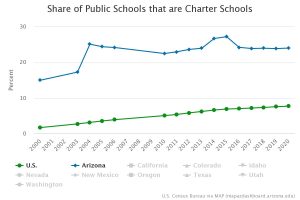
Charter Schools:
Since 2000, as shown in the graph below, the average population of United States charter schools within schools as a whole has steadily increased. Arizona, on the other hand, has displayed an extremely high percent, averaging around 24% of public schools being charter schools, yearly.
As defined on the Arizona State Board for Charter Schools’ website, charter schools were “created in 1994 to provide a learning environment that will improve pupil achievement and to provide additional academic choices for parents and students.”
AZ charter schools are mandated to have a mission statement ensuring the public is aware of the vision of the school. This is the common place to share the unique program/curriculum offered at the school, such as an extensive theater program, arts program, a STEM charter school, etc. In AZ, the majority of charter schools have a program or mission statement that make them stand out from the rest, providing parents and students with an assortment of specialty programs to consider.
While charter schools must admit students in an equitable process, such as a lottery, charter school demographics do not closely match the demographics of public-school students in the state.
According to an article published by AZCentral, “rigorous and progressive” charter schools tend to have a population consisting of more than 50% white, and less than 30% Hispanic. High risk or underfunded charter schools tend to have a population of less than 20% white students (Harris, et al). These statistics do not represent the demographics of the public-school student population, shown under the “Arizona Public School Demographics” section. While Arizona charter schools are supposed to admit students equitably, there are many allegations of corruption in admitting students to charter schools, including verbal recruiting.
Budgeting/Funding:
Arizona’s total state public education budget in 2021 was $9.18 billion, and average per pupil expenditure was $8,791. AZ receives $1.23 billion from the federal government in funding, equaling $1,159 from the federal government per pupil (Hanson).
Expenditure per pupil is broken down into the following categories:
- Federal funding: $1,159 per pupil

Via: educationdata.org. - State funding: $3,957 per pupil ($4.46 billion total)
- Local Funding: $3,913 per pupil ($4.41 billion total)
Arizona is well below the average per pupil expenditure in the United States, $12,624, emphasizing Arizona’s lack of public-school funding per pupil. Source: (Hanson).
Arizona Public School Tests and Standards:
In December 2018, the Arizona Board of Education voted to approve “Arizona’s College and Career Ready Standards” and no longer use the “Common Core” standards (Staff).
Students are tested in the following categories on the following tests:
- Arizona’s Instrument to Measure Standards (AIMS): Science
- Tests students in science in grades 4 and 8, and grades 9-11. Goal is to meet or surpass science standards during each test.
- AZMerit: English Language Arts, Math, Algebra I, Geometry, Algebra II
- An annual statewide test measuring mathematics in grades 3-8, and English language arts in grades 3-11. This test is also used as end of class evaluations in: Algebra I, Algebra II, and Geometry.
Source: (“Arizona Schools”).
Biggest differences from “Common Core” Standards:
- Grades 3-5 must learn to read and write in cursive
- Elementary schools teach about telling time and understanding money
- Arizona does not currently use the “Next Generation Science Standards,” yet frequently debates whether or not to bring them to law in AZ public schools (Staff).
2018-2019 Results (% means % of students who met/exceeded standard, via “Arizona Schools.”):
Science:
- All students: 52%
- Hispanic: 40%
- White: 68%
- Black: 37%
- Native American: 26%
- Two or more races: 61%
- Asian: 78%
- Pacific Islander: 49%
Algebra II:
- All students: 40%
- Hispanic: 30%
- White: 51%
- Black: 25%
- Native American: 20%
- Two or more races: 40%
- Asian: 73%
- Pacific Islander: 42%
English:
- All students: 42%
- Hispanic: 32%
- White: 56%
- Black: 30%
- Native American: 20%
- Two or more races: 51%
- Asian: 70%
- Pacific Islander: 42%
Failure to meet standards:
State law proclaims if a student is “well below” grade 3 level reading while in the 3rd grade, the student must repeat the year.
This law is quite vague, as it is the teacher’s decision on whether the student progresses to the 4th grade or repeats the 3rd grade. Some schools in AZ test as poorly as only 11% of the grade truly passing the standard, such as Sunnyside, AZ. As for the remaining 89% of the grade, the teacher decides who progresses (Cavazos).
While extreme quantities of students do not meet or exceed the standards, with high student enrollment and lack of funding, the vast majority of students progress to the next grade, even if performing in the bottom tier in comparison to their peers.
Corporal Punishment:
Arizona is one of 15 states that permit corporal punishment (physical punishment, such as caning or flogging) with discretion of the district’s local school board. Furthermore, AZ state education department does not require teachers and administration to track or report corporal punishment instances. This comes from the belief by some AZ parents that corporal punishment may be a useful form of punishment and educational instruction when used effectively and appropriately (Caulfield).
Teacher Qualifications and Wages:
The chart below details the requirements and certification needed for various roles in Arizona public schools:
- Graphs from (“What Tests Do I Need to Take?”)
| Type of Certification or Endorsement |
Tests Required | |||
|---|---|---|---|---|
| Professional Knowledge Test | Subject Knowledge Test(s) | Constitutions of the United States and Arizona*** | Administrator Tests | |
| Arts Education Certification (PreKto12) |
or |
or or or |
|
blank |
| Early Childhood Certification (BirthtoGrade 3) |
|
blank | ||
| Early Childhood Endorsement (BirthtoGrade 3) |
blank | |||
| Elementary Certification (Grades Kto8) |
|
blank | ||
| Reading Endorsement Kto8 | blank | blank | ||
| Reading Endorsement 6to12 | blank | blank | ||
| Reading Endorsement Kto12 | and |
blank | blank | |
| Middle Grades Certification (Grades 5to9) |
or |
|
blank | |
| Secondary Certification (Grades 6to12)dagger |
(see Tests for available fields) |
|
blank | |
| Special Education Early Childhood Certification |
|
blank | ||
| Special Education Hearing Impaired |
|
blank | ||
| Special Education Mild/Moderate Disabilities | blank |
|
blank | |
| Special Education Moderate/Severe Disabilities |
|
blank | ||
| Special Education Visually Impaired |
|
blank | ||
| Speech-Language Pathologist | blank |
|
blank | |
| Career and Technical Education Certification |
blank |
|
blank | |
| Administrator Certification: Superintendent Principal Supervisor |
blank | blank | blank |
|
| Subject Matter Expert Certification (Grades 6to12) |
blank | |||
|
* Not required for individuals who hold a Certificate of Clinical Competence in Speech-Language Pathology or who have passed the national exam. |
||||
|
** Candidates have three years under a valid teaching certificate to fulfill this requirement. |
||||
|
*** Candidates have three years under a valid teaching certificate to fulfill this requirement, unless they are teaching a course in history, government, social studies, citizenship, law, or civics, in which case this requirement must be met in one year. The successful completion of appropriate college coursework covering the Arizona and U.S. Constitutions may also be used to meet this requirement. |
||||
| dagger The secondary certificate requires an approved area for grades 6to12. Therefore, a middle grades subject knowledge test may not be used as the first subject knowledge test required for a secondary certificate. Once a secondary certificate is issued, a middle grades approved area may be attached to the certificate as an additional approved area. | ||||
|
double dagger Candidates have two years under a valid teaching certificate to fulfill this requirement. |
Mathematics Requirements:
| Approved Certification Areas | Certification Coverage | Approved Test |
|---|---|---|
| Middle Grades Mathematics | Allows educators to teach Mathematics in grades 6–8 |
NES Middle Grades Mathematics |
| Middle Grades/Early Secondary Mathematics |
Allows educators to teach Algebra I, Geometry, Statistics and Probability, General Mathematics, and Foundational Mathematics in grades 6–12 |
NES Mathematics (Middle Grades and Early Secondary) |
| Mathematics | Allows educators to teach all Mathematics in grades 6–12 |
NES Mathematics |
Middle school teaching:
| Approved Area | Test Required |
|---|---|
| Middle Grades General Science | Middle Grades General Science or General Science |
| Middle Grades Language Arts/Reading | Middle Grades English Language Arts or English Language Arts |
| Middle Grades Mathematics | Middle Grades Mathematics or Mathematics (Middle Grades and Early Secondary) or Mathematics |
| Middle Grades Social Studies | Middle Grades Social Science or Social Science |
Teacher wages:
The average teacher salary in AZ as of April 26, 2022, was $60,354. Salaries range from $52,685 to $69,692. Arizona does not pay teachers more based on advanced degrees, and district school boards have the authority to set/change teacher salaries (“Public School Teacher Salary in AZ”).
Teacher Unions:
The most popular teacher unions are:
- Arizona Education Association (more than 20,000 members, largest professional association for public school employees in AZ)
- American Federation of Teachers Arizona
- Arizona Professional Educators
How are teachers evaluated?
The “Arizona Model for Measuring Educator Effectiveness” consists of the following categories used to analyze the performance of teachers (“Teacher Evaluation Policy in Arizona”):
- Teaching performance
- Student academic progress
- Surveys
- 2 observations each year from school administration or other teachers
Voucher Programs:
In February 2022, Arizona’s GOP controlled Senate voted to approve a massive school voucher program, allowing over 690,000 students to qualify for Arizona’s state voucher program: Empowerment Scholarship Accounts (allows families to use public funds to pay for private school, homeschooling, tutoring, therapy services, etc). Any student who attends a low-income school, has a disability, qualifies for federal food stamps, welfare or housing, as well as children of active military duty, disabled parents, firefighters, police, doctors, and nurses, or residing in an Indian Reservation (Christie), qualify for vouchers. This concept is highly controversial and heavily debated. While over 700,000 students in AZ are now eligible for the Empowerment Scholarship Accounts, only about 10,500 current students receive the voucher, costing Arizona more than $150 million per year. Of the 10,500 students receiving the voucher prior to the new legislation, over 50% are disabled, and the vouchers are used in assisting student day to day life and ability to gain a valuable education in a form of their choosing (“Arizona School Choice”).
Arizona Public Schools Facts:
- Arizona allows students in public schools to pray and/or meditate while class is in session (FindLaw Staff).
- In February 2022, the Arizona House of Representatives voted to ban the teaching of Critical Race Theory (CRT) while putting limits on the teaching of race and gender in school. The teaching of material that “promotes or advocates for any form of blame or judgement on the basis of race, ethnicity, or sex” is banned in AZ public schools. This comes at what lawmakers say as removing the feeling of “discomfort” discussions of race, ethnicity, and sex may cause students (Cooper).
- Homeschooled students are not required to show proof of compliance with state educational standards.
- School records in Arizona are not open to the public. They may be reviewed by seeking permission via school administration to students and parents over the age of 18 (“Parent Guide to School Choice”).
- If schools do not receive enough enrollment, they shut down. This directly aligns with Arizona’s general trend of school choice. Families and students decide which schools to attend, or in other words, which schools to keep reopening, and which schools to shut down.
Analysis:
Inequality:
After reviewing the above data analyzing the specifics of Arizona public schools, differences in test results within varying demographics is a red flag.
Arizona public schools, and as a state, face extreme inequalities within race and income. When comparing test results, it is evident White and Asian individuals in Arizona public schools are sizably outperforming other demographics. Only 27% of African American students pass standardized Math tests, whereas 56% of White students pass standardized math tests. 20% of Native American students pass standardized English tests, and 21% pass standardized Mathematics tests. Asian students perform the highest on standardized tests, as roughly 70% of Asian students pass standardized Mathematics tests and 70% pass standardized English tests.
Why are these differences in testing within varying demographics so large?
Taking statistics a few steps farther displays imperative data. 18% of African American students are below the poverty line, compared to just 9% of White students below the poverty line. Native Americans consist of the largest population, as 34% are below the poverty line. These inequalities enhance education testing differences.
26.6% of African American renters in AZ say they contribute more than 50% of their monthly income to rent, making them severely cost-burdened. Additionally, homeownership of African Americans fell from 44% to 30% from 2007 to 2016, while White home ownership has gone from 75% to 70%.
15% of inmates in Arizona prisons are African Americans, while 5% of the AZ population is African American. Reports share African Americans are sentenced to longer prison time than White counterparts for the same crimes. African American Arizona citizens receive sentences more than 50% longer than White citizens for drug possessions and offenses. Additionally, White citizens commit 78% of all violent crimes in AZ and 82% of all property crimes, yet these inequalities for African Americans still remain.
All of these inequalities contribute to lower success rates amongst Native Americans and African Americans in educational testing in AZ public schools. White children are performing higher on standardized tests because the majority have greater household income and are financially stable. As a result, White parents have an easier time monitoring their children’s educational journey, enforcing homework, motivating their child, etc. As a result, African Americans and Native Americans are forced to handle financial troubles, prison inequalities, and matters involving putting a roof over one’s head and food on the table, rather than monitoring children’s education. There is much to address.
What is the state of Arizona implementing to fix these inequalities, and close the gap between student standardized test scores? The Arizona Senate is enhancing them, rather than closing them.
In Feb. 2022, the GOP led Senate voted to increase the students who qualify for student vouchers, as mentioned under the “Voucher Program” tab above. Included in these qualifying students are the children of firefighters, police, nurses, and doctors, alongside children on welfare or food stamps. While children on food stamps and welfare may greatly benefit from the school vouchers, working to lower the income gaps in Arizona, and in turn, lower the standardized test scores gap, the children of firefighters, police, nurses, etc. do not need these vouchers. Essentially, the newly implemented legislation in February has given financially stable families the option to pursue school vouchers.
It is nearly impossible to close the income and standardized test score gaps in Arizona when programs are financially supporting low-income individuals, and financially stable individuals.
The state of Arizona should heavily consider legislation or programs that work to lessen the income gaps between demographics in AZ, which will eventually trickle to educational outcomes, closing the inequality gaps that currently plague Arizona public schools.
Source: (MacDonald-Evoy).
School Choice Trend:
While Arizona has become a beacon of school choice in the United States, their extreme quantity of charter schools and public schooling options is lessening the quality of the education.
Having such a high quantity of school forces school boards attention to be scattered amongst a large array of schools. In addition, funding must be spread to each and every school, lessening its impact as it is divided up amongst public school options.
As a result, Arizona schools lack adequate resources to properly run the schools in operation. For example, the student to counselor ratio in Arizona is 716:1, when the recommended ratio is 250:1. This is the worst counselor to student ratio in the country (Fernandez).
Students do not have access to proper counseling in public schools, removing the vital resource students nationwide are utilizing. As a result, college recommendation letters are lesser quality, and students are not able to discuss their classes with their counselors. Counselors simply have too much on their plate, and not enough time and resources to meet with all of their students.
While Arizona parents and families greatly value variety within public education, exploring options related to closing some schools and condensing resources may provide a more well-rounded educational experience for students. Attending a school with adequate guidance counseling staff and funding may increase overall performance within school, and on standardized tests.
Sources:
“Arizona School Choice.” Arizona Governor Doug Ducey Office of Education, Arizona School Choice | Office of Education (azgovernor.gov). Accessed 9 May 2022.
“Arizona Schools.” GreatSchools.org, 2022 Arizona Schools | Public, Charter, & Private School Ratings (greatschools.org). Accessed 7 May 2022.
Caulfield, Claire. “Reported Cases of Corporal Punishment at Arizona Schools Drastically Drops.” KJZZ 91.5, Reporting Of Corporal Punishment At AZ Schools Drastically Drops | KJZZ. Accessed 8 May 2022.
Cavazos, Valerie. “More Arizona Students at Risk of Being Held Back.” Arizona’s Family, More Arizona students at risk of being held back (azfamily.com). Accessed 8 May 2022.
Christie, Bob. “GOP-Led Arizona Senate Approves Huge School Voucher Expansion.” Fox10 Phoenix, GOP-led Arizona Senate approves huge school voucher expansion (fox10phoenix.com). Accessed 7 May 2022.
Cooper, Jonathan J. “Arizona House Votes to Ban Critical Race Theory in Schools.” Fox10 Phoenix, Arizona House votes to ban critical race theory in schools (fox10phoenix.com). Accessed 7 May 2022.
Fernandez, Caleb J. “Arizona Public School System Ranked Worst in America, Study Says.” KGUN9 ABC Tucson, Arizona public school system ranked worst in America (kgun9.com). Accessed 9 May 2022.
FindLaw Staff. “Arizona Revised Statues Title 15. Education 15-110. Rights of Students at Public Educational Institutions; Limitations; Definition.” FindLaw, Arizona Revised Statutes Title 15. Education § 15-110 | FindLaw. Accessed 8 May 2022.
Hanson, Melanie. “U.S. Public Education Spending Statistics.” Education Data Initiative, U.S. Public Education Spending Statistics [2022]: per Pupil + Total (educationdata.org). Accessed 8 May 2022.
Harris, Crag, et al. “The Rise of Big Charters in Arizona was Fueled by Powerful Friends.” AZCentral, Arizona’s rise of big charter schools was fueled by powerful friends (azcentral.com). Accessed 9 May 2022.
“High School Graduation Rates.” Making Action Possible for Southern Arizona, High School Graduation Rates | MAP AZ Dashboard (arizona.edu). Accessed 8 May 2022.
MacDonald-Evoy, Jerod. “Data Show Arizona’s Racial Inequalities in Education, Poverty, Prisons.” AZ Mirror, Data show Arizona’s racial inequities in education, poverty, prisons (azmirror.com). Accessed 8 May 2022.
McFarland, Joel. “Trends in High School Dropout and Completion Rates in the United States: 2018.” National Center for Education Statistics, Trends in High School Dropout and Completion Rates in the United States: 2018. Accessed 7 May 2022.
“Parent Guide to School Choice.” Arizona Charter Schools Association, parent-guide-to-school-choice-combined_2_0.pdf (azgovernor.gov). Accessed 9 May 2022.
“Public School Teacher Salary in Arizona.” Salary.com, Public School Teacher Salary in Arizona | Salary.com. Accessed 9 May 2022.
Staff, Rak. “Q&A: Arizona’s New English Language Arts and Math Standards Explained.” Raising Arizona Kids, Q&A: Arizona’s new state learning standards explained (raisingarizonakids.com). Accessed 7 May 2022.
“Teacher Evaluation Policy in Arizona.” National Counsil on Teacher Quality, Evaluation_Timeline_Brief_Arizona (nctq.org). Accessed 7 May 2022.
“What Tests Do I Need to Take?” Arizona Educator Proficiency Assessments, What Tests Do I Need to Take? (nesinc.com). Accessed 8 May 2022.
Contact [email protected] with questions/concerns related to this page.