By Eleanor Donahue
State Fast Facts:
All ‘fast fact’ information [5]
Population: 3,042,017
Educational Attainment Across the State:
- Less than 9th Grade: 4.84%
- 9th-12th Grade: 8.59%
- High School Graduate: 34.03%
- Some College: 22.35%
- Associates Degree: 7.16%
- Bachelor’s Degree: 14.78%
- Graduate Degree: 8.25%
Income
Average Income: $34,326
Average Male Income: $40,145
Average Female Income: $29,731
The report below presents facts and figures that provide a current picture of education in the state of Arkansas. Additionally, influential trends and recent events have been included for further context and understanding.

Overview of Public Schools:
Total Public School Student Population
- During the 2020-2021 school year 473,004 students attended Arkansas public schools [1]
- For the 2021-2022 school year there are 27,744 students enrolled in 172 private schools across the state [6]
- 81% of private schools in Arkansas are religiously affiliated (most commonly Baptist and Christian)
Student Demographics [1]
-
- Race/Ethnicity:
- White: 59.8%
- Native American: 0.6%
- Asian: 1.7%
- African American: 19.7%
- Hawaiian/ Pacific Islander: 13.7%
- Hispanic/Latino: 3.5%
- English Language Learners: 8%
- Poverty rates: 66%
- Special Education: 13%
- Race/Ethnicity:
Graduation Rates [3]
-
-
- Total: 88%
- Male: 85.8%
- Female: 77.4%
- American Indian/Alaska Native: 79%
- Asian: 94%
- Hawaiian/Pacific Islander: 76%
- Hispanic: 84.7%
- Black: 84.7%
- White: 89.6%
- 2+ Races: 87%
- Economically Disadvantaged: 84.8%
- Limited English: 82.8%
- Disabled Students: 82.6%
- Homeless: 76%
- Foster care: 68%
-
Expenditures and Budgets:
Total State Public Education Budget
- Currently: $2,499,500 [4]
- For the 2022-2023 school year, Governor Asa Hutchinson has proposed the biggest education budget increase in more than a decade. He proposed a $30.5 million increase which would result in a $2.53 billion budget.
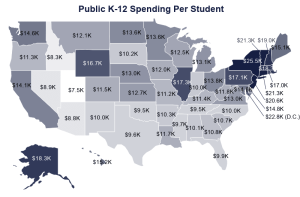
Average National per Pupil Expenditure
-
-
- On average $12,624 per student [2]
-
Average per Pupil Expenditure in Arkansas
- Over the 2020-2021 school year, $10,820 was spent on average per student [1]
- Arkansas received $1,253 in federal funding per student over the 2020-2021 school year [2]
High/Low per Pupil Expenditure Across Arkansas [5]
- The highest per pupil expenditure within Arkansas was in the Mineral Springs School District over the 2019-202 school year at $17,503.
- The lowest per pupil expenditure within Arkansas was $7,783 over the 2019-2020 school year in the Benton School District.
Teachers:
Average Teacher Salary
- Over the 2020-2021 school year the average teacher salary was $52,552 [1]
- The national average for teacher’s salary is $63,645 which means teachers in Arkansas are being paid more than $10,000 less than the average teacher. [15]
Teachers Unions and Associations
National Education Association (NEA) – Arkansas Education Association (AEA) [20]
AEA is the oldest, largest education association in Arkansas.
Core Values
- Equal opportunity
- A just society
- Democracy
- Professionalism
- Partnership
- Collective action
Benefits that the AEA has obtained
- Designated planning time for teachers
- Duty-free lunch periods for teachers
- Minimum salary schedule
- Grievance procedure required by law
- Personnel policy committees and collective bargaining
- Teacher fair dismissal act
- Retirement benefits
- Sick leave, including transfer of sick leave from district to district and pregnancy leave recognized as sick leave
- Professional staff development credit and guaranteed leave for AEA Convention workshops
- Health insurance for school employees
Association of American Educators (AAE) – Arkansas State Teachers Association (ASTA) [21]
- ASTA is a non-profit, non union, professional association that was created by educators and is still led by educators. They do not utilize collective bargaining.
- “We are dedicated to improving education through cooperation, not confrontation.”
- ASTA works and advocates for professional development, protection, and teacher advocacy.
Evaluation Methods and Measures
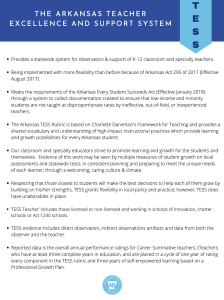
The State of Arkansas created the Teacher Excellence and Support System (TESS) which is an evaluation and observation system for teachers across the state to ensure they are providing students with effective and fair education while also ensuring that the teacher themself is be provided with support and guidance [23].
“The Arkansas Teacher Excellence and Support System (TESS) provides a statewide system for observation and support of K-12 classroom and specialty teachers” [23].
The TESS system also provides learning modules, rubric descriptors, and educator support and development rules to teachers [25]. See below for an in depth summary of the program.
Testing:
All ‘testing’ information [13].
- Act 930 of 2017 requires all students to take the following assessments:
- The English Language Proficiency Assessment for the 21st Century (ELPA21)
- Criterion-Referenced Tests (CRTs)
- ACT Aspire Assessments
- Beginning in 2015-2016 the ACT Aspire was required by the state of Arkansas in English, reading, writing, math, and science. It is used as an end-of-year summative assessment to check all public school students grades 3-10.
- Dynamic Learning Maps Assessments
- In 2018-2019 students in grades 3-10 with “severe cognitive disabilities” were required to begin taking this assessment in English Language Arts, math and science
- K-2 Assessment
- This assessment is required to be administered three times per school year in order for teacher to “make data driven instructional decisions”. Schools are allowed to choose between four tests based on which best meets the needs of the K-2 students. See the four assessments below
- Curriculum Associates: i-Ready
- Istation: ISIP
- NWEA: MAP Growth
- Renaissance: Star
- This assessment is required to be administered three times per school year in order for teacher to “make data driven instructional decisions”. Schools are allowed to choose between four tests based on which best meets the needs of the K-2 students. See the four assessments below
- The ACT
- Administered in the spring to 11th grade students enrolled in public school. Theses scores can be used to qualify for scholarships and/or to be used as a part of the student’s college application.
- The Arkansas Civics Exam
- Beginning during the 2018-2019 school year, students who attend Arkansas public schools wishing to graduate are required to take this exam and receive a score of 60% or greater.
School Accountability: District Support
All ‘School Accountability: District Support’ information [14].
- The Division of Elementary and Secondary Education provides progressive levels of support to schools/districts that are not meeting state and federal standards and regulations.
General: provides general guidance and resources for the local education agency (LEA). School Improvement Plan and Literacy Plan required.
Collaborative: Temporary technical assistance provided. School Improvement Plan and Literacy Plan required. District Support Plan provided if requested.
Coordinated: Occurs in a district where 40% or more of students test below the reading requirements in the previous academic year. Plan provides long-term technical assistance and monitoring. School Improvement Plan, Literacy Plan, and District Support Plan are required.
Directed: Occurs in a district where 50% or more of students test below the reading requirements in the previous academic year. This level of support includes long-term guidance in the “development & implementation of school-level plans, recourse allocation, monitoring, and evaluation”. School Improvement Plan, Literacy Plan, and District Support Plan (including a district literacy plan that is approved by the Division of Elementary and Secondary Education -DESE) are required.
Intensive: Occurs when the Commissioner of the Sate Board of Education (SBE) makes a recommendation. Intensive, long-term guidance and SBE directed support. School Improvement Plan, Literacy Plan, and District Support Plan (including a district literacy plan that is approved by DESE) are required.
Curriculum:

Content Area Standards
English Language Arts [17]:

Mathematics [18]:
- Make sense of problems and persevere in solving them.
- Reason abstractly and quantitatively.
- Construct viable arguments and critique the reasoning of others.
- Model with mathematics.
- Use appropriate tools strategically.
- Attend to precision.
- Look for and make use of structure.
- Look for and express regularity in repeated reasoning.
Graduation Requirements
All ‘Graduation Requirements’ information [11].
- To graduate, students must meet or exceed the Smart Core requirements which were created to help all students who graduate from the Arkansas education system be ready “to succeed in college and career”. See below for requirements:

Data Analysis [27]
On Resource and Opportunity Disparity Within School Districts of Arkansas:
Arkansas Public Schools have consistently been ranked in the bottom 20th percentile of schools across the country. This pattern is most likely due to the resource disparities such as transportation, school facilities, school finance, teacher quality, and curriculum between school districts throughout the state. Another important factor in this disappointing ranking is the fact that Arkansas is “one of the most undereducated citizen populations in the nation when looking at the percentage of adults with college degrees and high school diplomas; ranking within the bottom five states for both categories” (Simmons, 2021). When generations of people have been raised in a place that does not put high value on education a constant, vicious cycle is created and will result in the citizens putting little to nothing back into the system which further degrades it. In Arkansas citizens have historically voted against raising taxes for education reforms which prevents much of the change that is needed to improve the resources that can be provided and also prevents better resource allocation from being organized by state legislature.
It is important to note Arkansas’ state history of low teacher’s salaries, segregation, and insufficient legislative assistance and acknowledge them as potential sources for the problems that the present day education system faces. In Chicot County, one school district in Arkansas, during the 1929-1930 academic year the per-student expenditure for students of color was $6.36 while the per-student expenditure for students of the majority was $54.11 (Holley, 2020). Although this example is from 93 years ago, it highlights the shocking proof of a deep-rooted problem of racism and inequality which resulted in high quality education only being given to a certain group of students. While Arkansas has changed dramatically, one can still find shocking disparities between district resources.
In the study Disparities In Education Resources Within the State of Arkansas by Hunter Simmons done in May 2021 at the University of Arkansas, the Springdale School District in Northwest Arkansas was observed for education disparities within a singular school district. Prior to the 2005-2006 academic year, there was only one high school available (called Springdale High School) to students. During the 2005-2006 academic year a second high school, (Har-Ber High School) was opened. From the very beginning there were drastic disparities between “demographics, the number of students on free and reduced lunch, enrollment rates in advanced placement classes, and retention rates” (Simmons, 2021). The extreme differences between the resources being pumped into the two high schools resulted in differences in students’ trajectories based on which high school they attended. Based on this study, it appears that Har-Ber High School was conveniently opened, already with more resources, and in a location within the district that was surrounded with primarily white families.
The results of the study shows this exact phenomenon. There is a significantly greater number of caucasian students at Har-Ber High School compared to Springdale High School. Between the 2005-2006 academic year and the 2020-2021 academic year, the number of caucasian students consistently decreases at Springdale High School and increases at Har-ber High School. Simmons proposes this could be “evidence of red-lining and reminiscent of segregation when it comes to drawing the school district map” (Simmons, 2021).
Simmons continues to study the differences between free and reduced lunches, AP course availability and enrollment, dropout and withdrawal rates, per-pupil expenditures, college attendance rates following graduation, and the ratio of teachers of color to students.
In every observation the findings show that there are great disparities between Springdale and Her-Ber High Schools. Springdale High School consistently showed higher free and reduced lunch rates, lower AP course availability and enrollment, higher dropout and withdrawal rates, lower per-pupil expenditures, and lower college attendance rates. On the other hand, Her-Be High School consistently showed lower free and reduced lunch rates, higher AP course availability and enrollment, lower dropout and withdrawal rates, higher per-pupil expenditures, and higher college attendance rates.
This recent study is a clear example of the shocking resource disparities between schools in Arkansas, even schools within the same district. It is concerning to think that if there can be such obvious and alarming disparities between schools within the same district, what could disparities looking like between districts in different tax brackets look like?