Colorado Public Education Data
Stuart Howard

- Total Public School Student Population: 886,517 (As of October 2021)
- Source: https://www.cde.state.co.us/communications/newsrelease2021enrollment
- Total State Public Education Budget: $6,696,803,356 (2020)
————————————————————————————
Charts and Graphs
- Average Per Pupil Expenditures

* This is the most recent data from Colorado. In normal years, data from a few years back would still be accurate now, but because of the pandemic, those numbers would most likely be drastically different due to covid relief money that has come into the schools.
– Normally, one would think that urban areas receive more per pupil funding compared to rural areas. But in reality, it costs more per pupil to educate rural students. Transportation costs for those students can be higher because they are getting bussed from farther distances to the school. It also may cost more to acquire teachers because they might not want to live in rural areas. However, just because students are receiving more funding per pupil doesn’t necessarily equate to more resources per pupil.
- Student Demographics
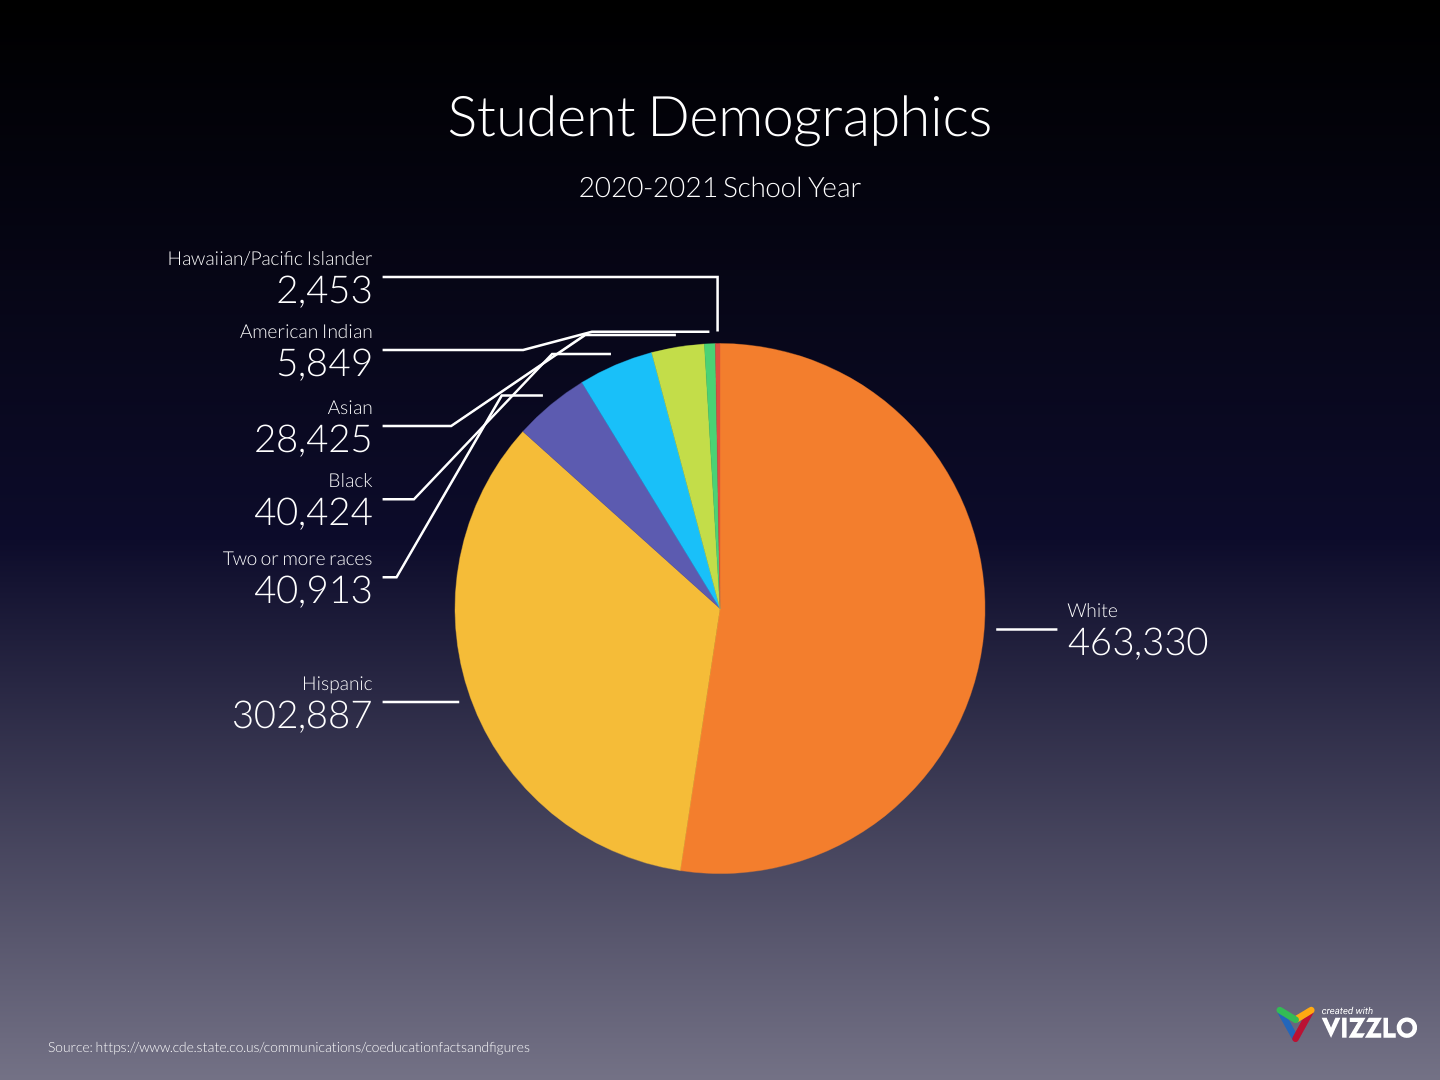
– Colorado has a relatively diverse demographic makeup. The two most prominent groups are Whites and Hispanics. Interestingly, at the high school I attended in Colorado (Battle Mountain High School), it was around 60% Hispanic and 40% White, which is opposite of the graph above. One of the shortcomings of this graph is that it only shows statewide data and not individual district data. But, the information is still helpful for our class and also potentially state policy makers.
- Graduation Rate Data

* The data presented in this chart is the most recent data for both the Colorado average and the national average together.
* The Colorado average for 2020-2021 (the most recent data) is 81.7%, so basically the same as 2018-2019.
– In this school year, the average graduation rate in Colorado was almost 8 points above the national average. This is very good. However, it will be interesting to see what the comparison looks like when the COVID-19 graduation data is available. One hypothesis is that the rates will go down due to the complicated situations of online classes, taking care of loved ones, and navigating the pandemic in general. But since Colorado has had relatively high graduation rates in the recent past, there could also be little change after the pandemic. It will be interesting to see the new data that comes out in the near future.

* This chart has more recent data compared to the last.
– The data presented here is interesting as well. The only demographic group to break the 90% mark is the Asian group. Whites’ rates are close to 90%, but then minority group rates sharply drop to around the 75% range. This disparity is pretty drastic. While the state in no way should neglect White and Asian groups, it may be helpful to invest more resources, whether they be monetary or something else, t0 the groups that do not have great graduation rates. If the goal is to have close to a 100% statewide average graduation rate, then Colorado needs to rethink how to approach the problem. A option could be to analyze the general challenges that face minority groups and work to address those problems in the schools so students can better focus on academics.

– This chart echoes much of what was said in the previous chart analysis. The gifted and talented graduation rate is more than 20 points higher than the rest of the categories. Again, there seems to be a disconnect that has yet to be addressed. Throughout my K-12 education, I was in the Gifted and Talented program. One of the things I noticed with me and my peers was that our parents were always involved in the schools and were constantly advocating for more accelerated programs to challenge us. We were all blessed with that additional support coming from home. However, not all students are. Students who don’t have parents that academically advocate for them have to navigate much of their educational career on their own. Additionally, they may have to contend with other challenges, such as having disabilities, limited English abilities, or limited economic resources. This most likely contributes to the trend seen above in the chart. Every student has potential and it is necessary that we provide them with what they need to be successful, no matter if a student is in Gifted and Talented programs or not.
- Average Teacher Salaries
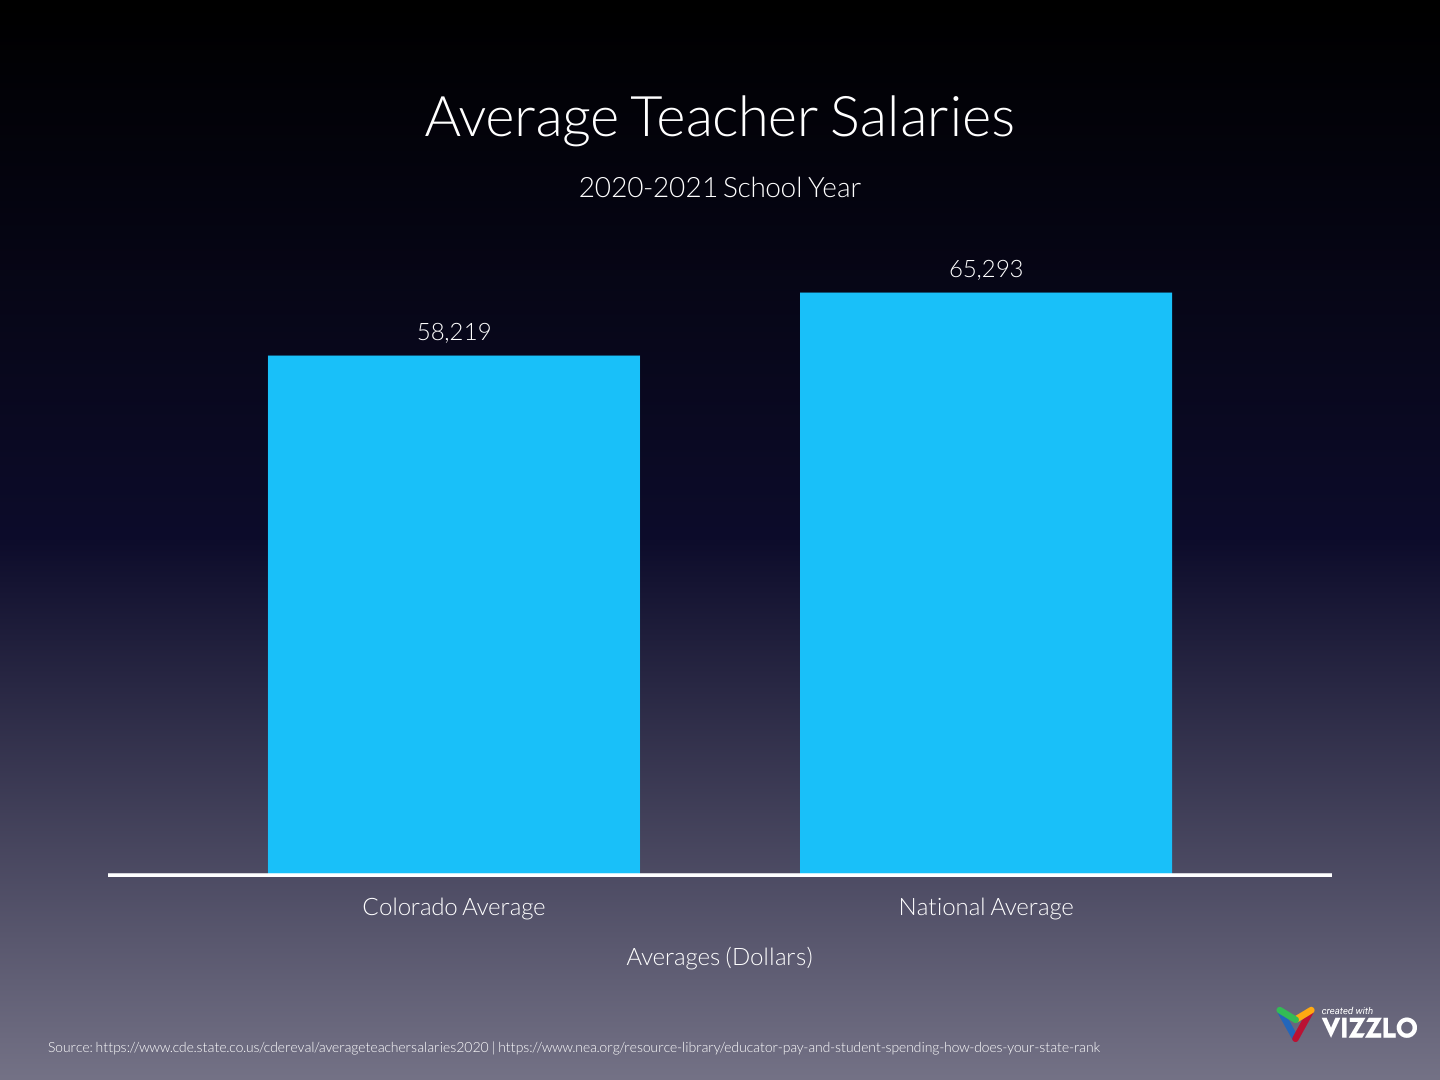
– Colorado falls below in the average teacher salary compared to the national average. Colorado is currently ranked at #26 in the nation for highest average teacher salaries, according to the National Education Association (2022). This is very close to the middle, so not great, but not terrible either. The state ranked #1 is New York, with a $90,222 average teacher salary, and the state ranked #51 (District of Colombia makes the total 51) is Mississippi, with a $46,862 average teacher salary (NEA, 2022). The disparity in salaries between states in interesting. Teachers are valued higher in some states than in others which is probably related to public opinion surrounding them. This is likely a reason that teachers unions are prevalent—they seek to change public opinion to be in favor of supporting teachers.
References
National Education Association. (2022, April 26). Educator Pay and Student Spending: How Does Your State Rank? | NEA. Educator Pay and Student Spending: How Does Your State Rank? Retrieved May 9, 2022, from https://www.nea.org/resource-library/educator-pay-and-student-spending-how-does-your-state-rank
- Presence of Teachers Unions


-
- In Colorado, there are two prominent teachers unions: the Colorado Education Association (CEA) and the Professional Association of Colorado Educators (PACE). Like other teachers unions, they organize teachers to fight for school-related causes, as well as provide various forms legal assistance to teachers for a membership fee.
- PACE provides liability insurance, legal protection, employment rights, scholarships, supplementary insurance, and professional resources to members.
- The CEA provides even more benefits through the National Education Association. Some of which include various forms of insurance, travel benefits, retirement benefits, and loan opportunities, to name a few.
- Below are links to the unions’ websites.
————————————————————————————
Data Analysis
Funding Inequities in Colorado and How the State is Fixing Them
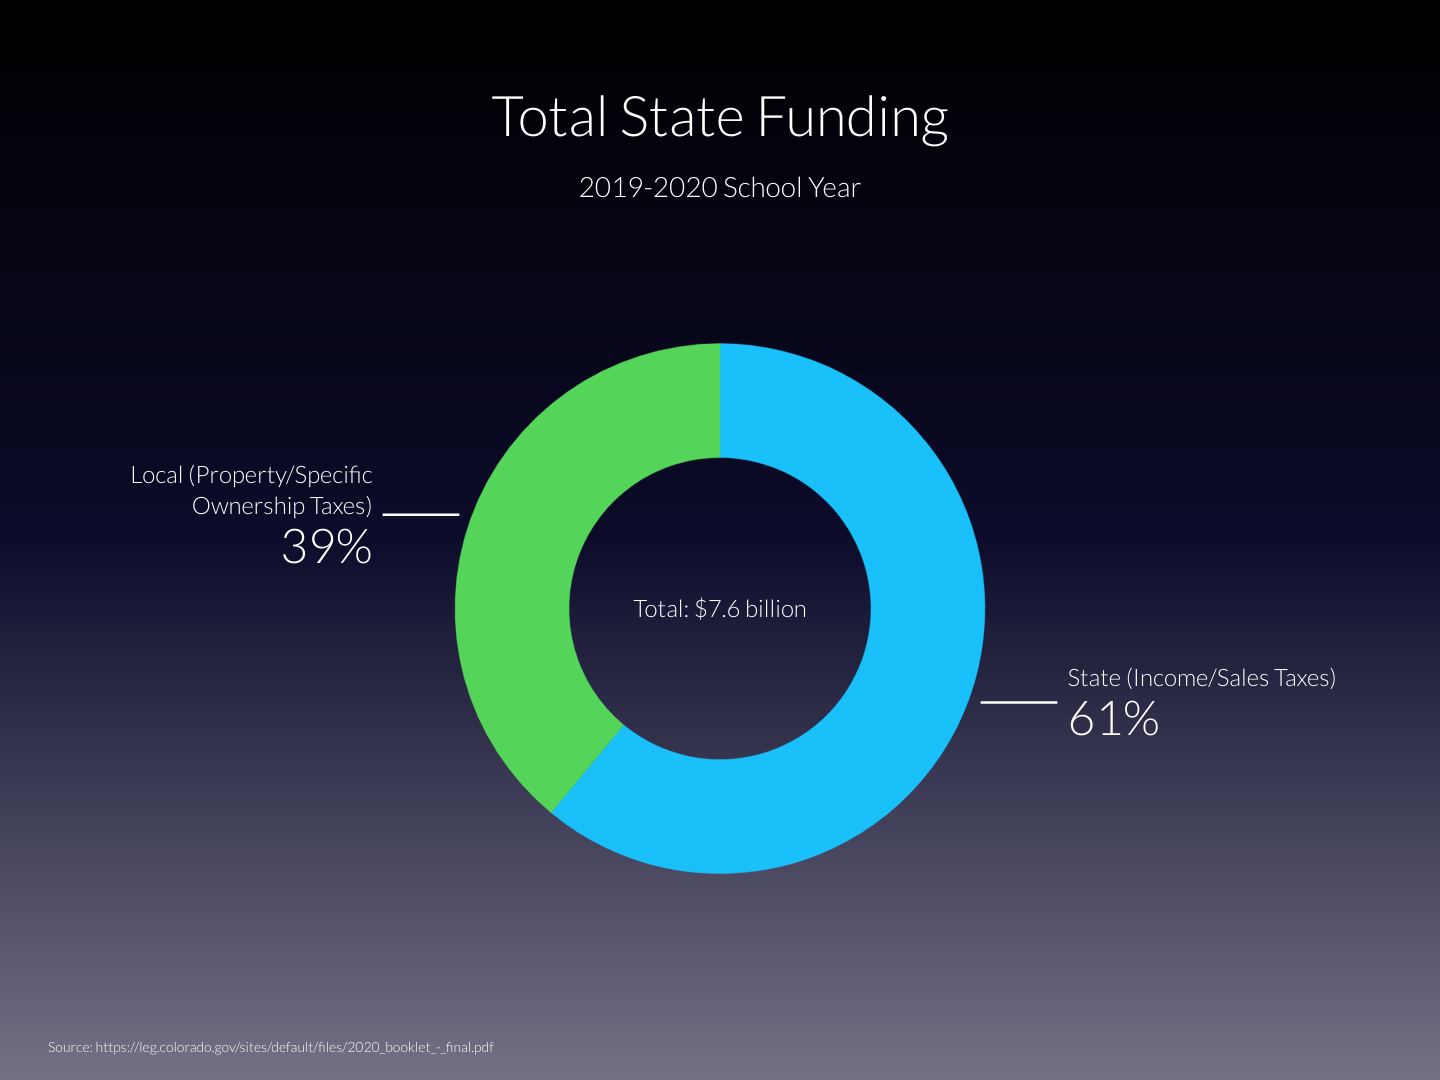
* This chart does not take into account other funding types such as federal grants. It only serves to show the ratio between the state and local allocation of funds. The total of $7.6 billion is also different from the data at the top of this page. This is due to discrepancies in how the statistics are compiled, which sources they come from, and what times they are published.
- As with many states, inequities persist in education due to statewide funding structures. Throughout the semester, we have learned that while money is not everything, it is one of the biggest indicators of school district success and can provide many benefits to students (Great Education Colorado, n.d.). In Colorado, one of the main reasons funding inequities exist is because of the disparity between property values. Colorado is extremely diverse in terms of property, ranging from wealthy resort areas and oil/gas fields to urban centers to impoverished rural towns. Because of this, wealthy areas are able to bring in more property taxes whereas poorer areas bring in less.
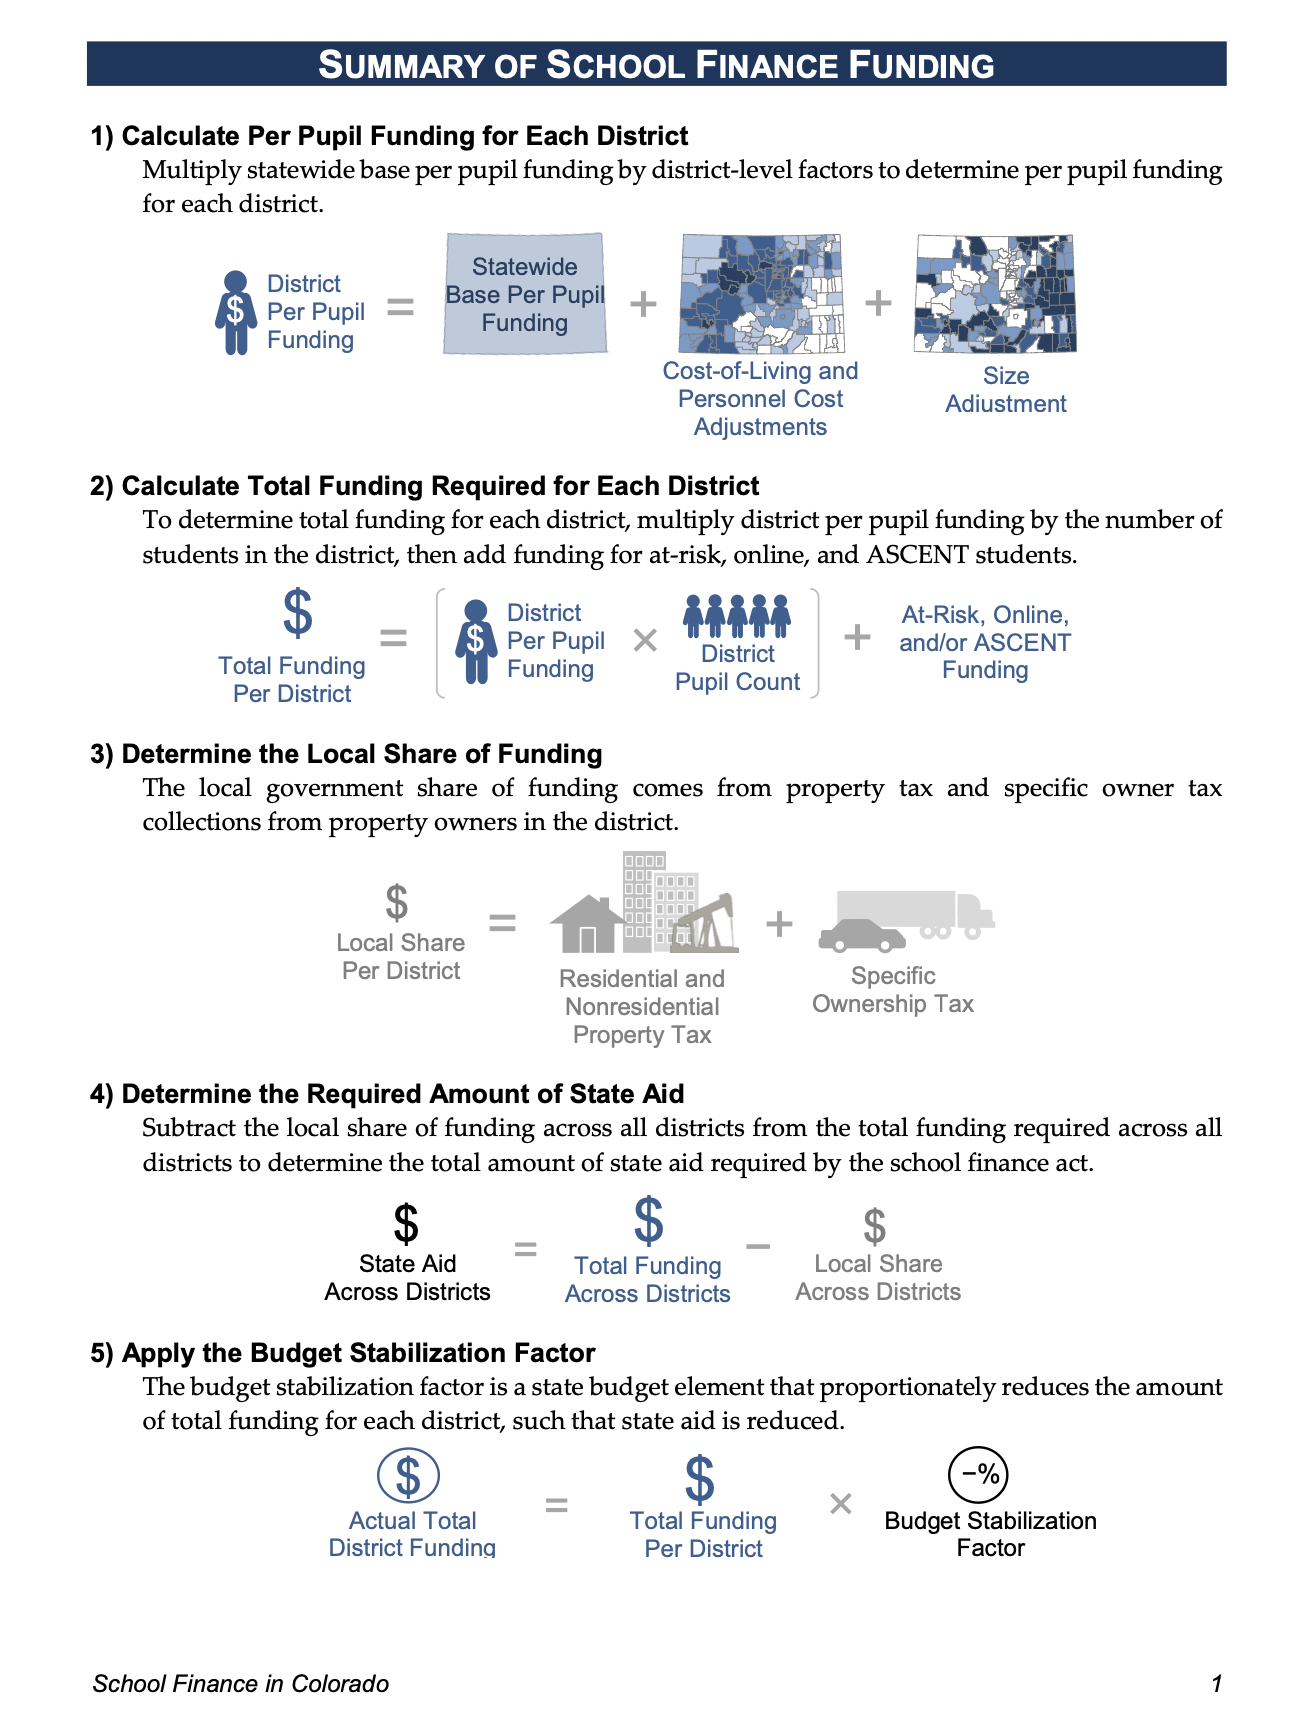
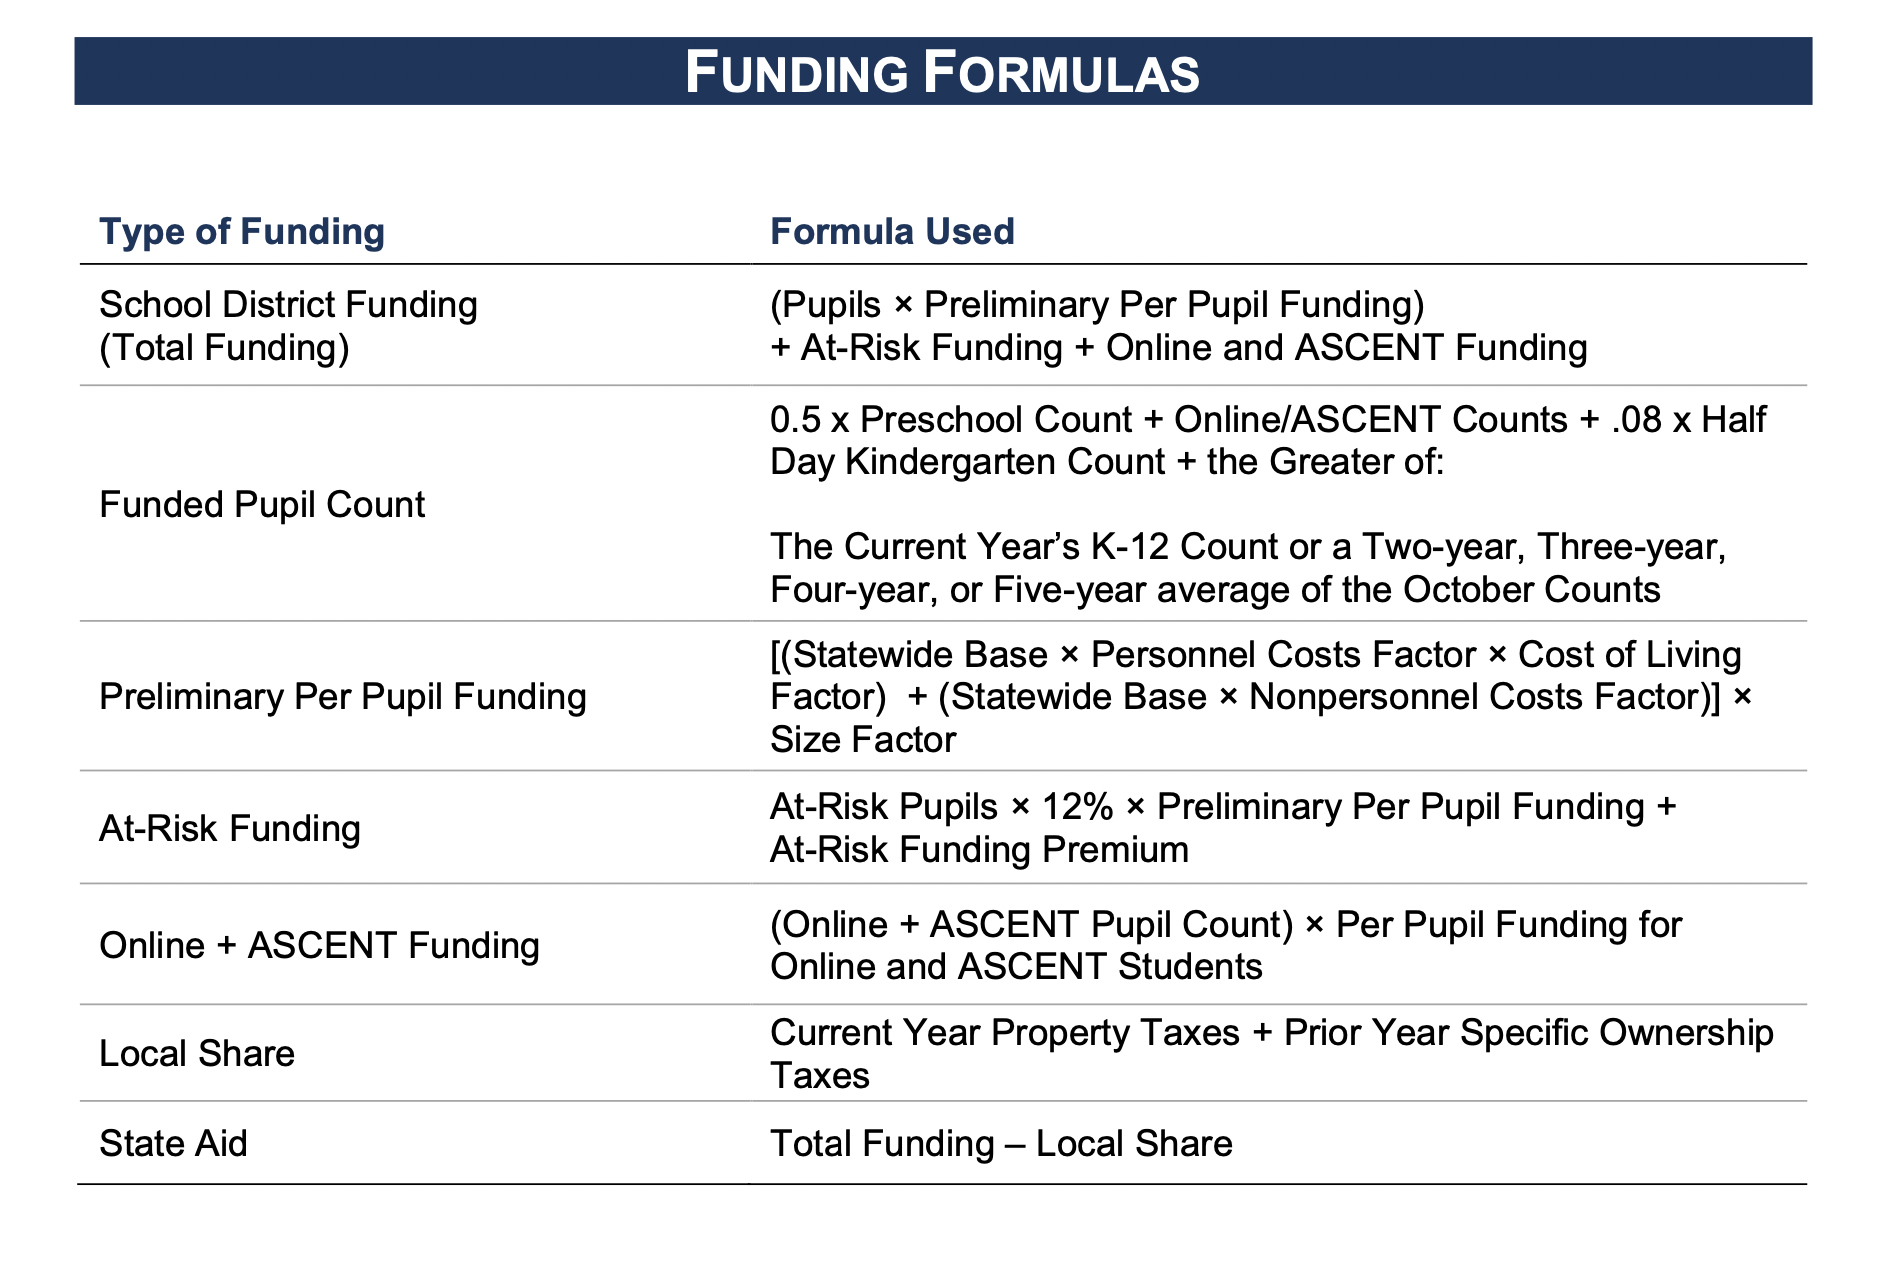
- Since this is an inherent quality of property-tax-based funding structures, Colorado has aimed to create new structures and funding formulas to even the playing field and equitably distribute education resources to all of the school districts. Interestingly, unlike other states, Colorado funds its schools mostly from the state General Fund. According to the Legislative Council Staff (2020), a nonpartisan research division of the Colorado General Assembly, in FY 2019-20, the total funding for public schools in Colorado was $7.6 billion, with the state contributing $4.6 billion (61%) and local areas contributing $3.0 billion (39%). Every year, the state acquires money from income and sales taxes that are deposited into the General Fund, whereas local areas acquire money from individual (residential) and business (commercial) property taxes (Legislative Council Staff, 2020). The state aid (the amount of money the state provides to the school districts) is then the calculated difference of the total funding minus the local share (see figure below for information on how these numbers are calculated). The factors that determine the total funding number help to equitably allocate money to various districts. For example, there are factors that take into account at-risk students, online students, costs of living, etc. When these factors are included in the funding formulas, they help to acknowledge and advocate for demographically and/or geographically marginalized groups. For more detailed information on the formulas, below is a brief summary provided by the Legislative Council Staff to better visualize the funding structures.
- Colorado also aims to provide funding equity through the mill levy statutes. For all districts in the state, there is a maximum mill levy of 27 mills. “In addition, a district’s levy cannot be higher than the levy required to cover the district’s total funding less specific ownership tax revenue” (Legislative Council Staff, 2020). Why is this the case? If the state allowed districts to collect more money than the required amount to fund statutory school finance obligations, then wealthier districts with higher property values could raise even more money and be flushed with cash. Other districts that do not have the luxury of high property values would not have the same resources, hence the reason for this law. There will still be funding disparities, but this law helps to even out the resources each state receives.
- Even though Colorado has tried to make the funding structures more equitable, there are still areas where the state falls short. For example, because of various factors in the per pupil funding calculations (cost of living, at-risk students) based on the Public School Finance Act of 1994, districts that are more expensive to live in are allocated more funding. Ironically though, districts that are expensive to live in typically have higher property values and are therefore able to raise more money without additional state funding (Gray, 2018). Those districts receive more money and are able to have more resources compared to other, less fortunate districts. Every year though, proposals are brought to the state legislature to reform some of the state funding structures and it will be interesting to see what the future holds in making Colorado public schools more equitable.
- Detailed Summary of School Finance Funding in Colorado (Legislative Council Staff, 2020)
- Colorado Funding Formulas (Legislative Council Staff, 2020)
References
Gray, H. (2018, November 26). What’s the Deal with Education Funding in Colorado? 5280. Retrieved May 7, 2022, from https://www.5280.com/2018/11/whats-the-deal-with-education-funding-in-colorado/
Great Education Colorado. (2022, May 5). Funding FAQs. Retrieved May 7, 2022, from https://www.greateducation.org/statistics-faqs/funding-faqs/
School Finance in Colorado Research Publication No. 746. 2020 School Finance in Colorado. (n.d.). Retrieved May 7, 2022, from https://leg.colorado.gov/sites/default/files/2020_booklet_-_final.pdf
————————————————————————————
Education News: Universal Free Meals for Students in Colorado
- During the past couple years of the pandemic, Colorado, like many other states, has received funding for universal free lunches in public schools. But, these funds are set to expire in the summer of 2022 and many legislators have been concerned about what’s next. Because of this, a new bill called HB22-1414 has been proposed, which according to Nick Coltrain from the Denver Post (2022), will “ask voters in November, via ballot measure, if they want to limit tax deductions for the wealthiest households to raise up to $100 million to pay for the program beginning in the fall 2024 school year.” If this bill becomes law, then universal free lunches will continue past the federal funding expiration date.
- Traditionally, Colorado’s free lunch program is only for families living at 185% of poverty or lower, which in monetary terms is an income of around $40,000 a year for a family of four (Kenney & Brundin, 2022). However, according to Danielle Bock, the director of nutrition services for the Greeley-Evans School District, even for families making more money than $40,000, it can still be hard to put food on the table (Kenney & Brundin, 2022). On paper, it may seem as though a family has a high income, but healthy food, living expenses, child care, and other expenses have risen in recent years and more and more families are living paycheck to paycheck. This is one of the arguments for expanding the free lunch program to all families versus just a select few. Opponents of the bill argue that the free lunches will not be free and the taxpayer will have to pick up the cost. While this is undoubtedly true, with this program, all students will have access to the free lunch program (Colorado General Assembly, 2022). So, if those opponents have children in the public school system, they will get free lunches as well. If they do not have children in the public school system, they can know that their tax dollars are going to a program that helps make the community better. The program will cost hundreds of millions of dollars to implement across the state, but there is potential that the program will help many students and families. If the program does not end up working out, the legislature can try to pass a new law to amend the program or eliminate it entirely. It will be interesting to see what the future holds.
- Much of the research conducted for this project was about graduation rates. While the Colorado graduation rates are relatively high, they still are not close to 100%. Could universal school lunches help in raising these rates? Interestingly, students participating in universal free lunch programs have been shown to have better academic performance in school (Schwartz & Rothbart, 2019). Additionally, students who have access to food are not distracted by hunger so they can focus better (Bogden, Brizius and Walker, 2012). Even though graduation rates were not discussed directly in these studies, it would make sense that food security could help raise graduation rates because students would be able to perform better in school and would not be distracted by hunger. However, more research is needed to correlate graduation rates directly with the availability of school lunches.
References
Bogden, J.F., Brizius, M., & Walker, E.M. (2012). Chapter E. Policies to Promote Healthy Eating in National Association of State Boards of Education. Fit, Healthy, and Ready to Learn (Chapter E). Arlington, VA: National Association of State Boards of Education.
Coltrain, N. (2022, May 3). Effort to continue free school meal programs, stalled in Colorado legislature, finds new life. The Denver Post. Retrieved May 7, 2022, from https://www.denverpost.com/2022/05/03/colorado-free-reduced-school-lunch-meal-program-ballot-measure/
Healthy Meals For All Public School Students. (2022). Colorado General Assembly. Retrieved May 7, 2022, from https://leg.colorado.gov/bills/HB22-1414
Kenney, A., & Brundin, J. (2022, March 18). Universal free school lunch is set to expire. Some Colorado lawmakers want to keep it going. Colorado Public Radio. Retrieved May 7, 2022, from https://www.cpr.org/2022/03/18/colorado-free-school-lunch-funding/
Meltzer, E. (2022, May 5). Free school lunch expansion could be decided by Colorado voters. Chalkbeat Colorado. Retrieved May 7, 2022, from https://co.chalkbeat.org/2022/5/5/23059355/free-school-lunch-colorado-ballot-measure-healthy-meals-all
Schwartz, A. E., & Rothbart, M. W. (2019, July). Let Them Eat Lunch: The Impact of Universal Free Meals on Student Performance. The Maxwell School Center for Policy Research. Retrieved May 7, 2022, from https://www.maxwell.syr.edu/docs/default-source/research/cpr/working-papers/wp-203-let-them-eat-lunch.pdf?sfvrsn=efae783d_8