By Olivia Cunningham
Basic Data
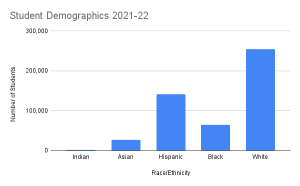
- During the 2021-22 school year, the public school enrollment was 513,709 students. Private school enrollment was 50,540 during that year. (Digest of Education Statistics, 2019)
- The total state public education budget was $12,000,000,000 in 2019 (School and State Finance Project)
- Average per pupil expenditure: $20,635 in 2022 (Per Pupil Spending by State 2022)
- Average national per pupil expenditure: $17,373 in 2021 (5th in the nation) (Per Pupil Spending by State 2022)
- 21 charter schools (2020) (Elementary and Secondary Information System)
Data Analysis
Connecticut public school inequities exist based on school choice and family wealth. Although public enrollment is high in the state of Connecticut (513,079 in 2021) with over 1,000 public schools, there is an overwhelming number of students who choose to go to private school (CT.gov). There are over four hundred private schools in the state alone. Because Connecticut has the highest income per capita, parents tend to send their children to private school where they assume the education is better. Even if the state publicly funds $22,831 per student for education, which is more than the national average, the stigma of private school being better in such a rich state will always be present (National Center for Education Statistics NCES). Even as of 2022, the state does not give out vouchers (CT Mirror).
The Connecticut Education Association exists to fight for the rights of public school teachers and to promote public education in order to overcome these inequalities. The state of Connecticut puts more emphasis on their adaptation to their common core standards with English and mathematics (Connecticut Education Association). The state’s English department desires to build knowledge through content rich nonfiction, reading, writing, and speaking grounded in evidence from text, and regular practice with complex text. Connecticut public school’s math department uses focus, rigor (conceptual understanding, procedural skill and fluency), and coherence (CT.gov) . The state tracks the failing schools and puts them under intense scrutiny to improve test scores and benchmarks for students. This will hopefully go a long way to help improve the education of students at those schools and thus help reduce some of those inequalities within the state.
In the News
Connecticut plans to ‘fully fund’ state education funding for local school districts moving forward. The goal is to make it easier for districts to higher teachers and social workers. The net funding for Hartford, for example, would increase by more than $24 million. Hartford residents Urban school districts are said to benefit the most by 2025. New Britain public school funding is estimated to increase about $18.2 million and $8.5 million in Manchester (Hartford Courant).
School funding has been an on-going issue in the state. Connecticut supplied the majority of their education funding through block grants in the past few decades. Michael Morton, the executive director of the State Finance Project said, the grants were “certainly not equitable, not transparent and not reflective of the needs of the district and the community.” Needs were not assessed based on students who qualify as low income and to districts where 60% of the students could not afford school lunch (Hartford Courant).
Accountability
- Next Generation Science Standards (Grades 5,8,11)

This chart shows the different categories within the Next Generation Science Standards (CT.gov). - English Language Proficiency (k-12)
- Connecticut Physical Fitness Assessment (4,6,8): The goal is to inform schools about focusing on fitness and physical activity in our schools and evaluate their success in aerobic endurance, flexibility, upper body, and abdominal muscle strength.
- Smarter Balanced Assessment (3-8): Consists of a computer adaptive test (in ELA and mathematics) and performance task (in mathematics). This assessment can be used to describe student achievement and growth as part of program evaluation and school, district, and state accountability systems (CT.gov).
How Do I Graduate?
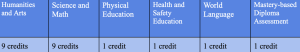
In order to graduate, students must have a minimum of 25 credits
If these standards are not met by students, they are unable to graduate.
Graduation Rates Data Analysis
One particular trend I noticed stems from the graduation rates in the state of Connecticut for public schooling. The overall rates between 2015 and 2020 have stayed relatively the same, between 87% and 88% (CT.gov). The different races and ethnicities that make up the total graduation rate vary year to year. The graduation of white and Asian students steadily increases, but other races like black and Indian have no consistent trend in graduation rates in Connecticut. In 2015, the graduation rate for white students was 92.5% and continued to increase as the rate in 2020 was 93.6%. For black students the graduation rate increases from 78.8% in 2015 to 80.2% in 2017 but trends back downward in 2019. Similarly, Indian students’ graduation rates trended downward, but their rates started out low and increased after 2019. Their rate started at 89% in 2015 and decreased to 85.3% by 2017. Asians and whites are the two races that consistently perform in the 90s, as they are the only two races that consistently perform that way. Most likely those are the two races that you would find living in more affluent areas in Connecticut. The blacks, Hispanics, and Indians and with the exception of a few outliers within 2017 and 18 in the Hawaiian or Pacific Islander section, for the most part perform in the 80s. You don’t see them performing in high numbers which could indicate that they are living in the less than desirable areas with the less than desirable schools or under performing schools (Elementary and Secondary Information System).
The consistent increase in the graduation rate for white students in a heavily white populated state like Connecticut supports the fact that they receive the best resources because of their wealth which translates into the best education. The performance of white students was very consistent as well as Asian students. Yes white students in the state are succeeding, but the other races that make up the public school system are not. Wealthy families living in Connecticut typically send their children to private school. Lower income families unfortunately do not have that option. They end up having to send their children to lower performing schools because they can’t afford to send their students to high performing private schools or live in affluent areas where those high performing public schools exist. The overall graduation rate in Connecticut is high but it could always be higher. Investing in lower performing schools and or providing vouchers for private schools would be two ways toward reaching that goal (Elementary and Secondary Information System).
Failing To Meet Standards
Teacher contracts are at risk of termination if they fail to meet the standards of “continuous”, “part time”, or “full time” employment after being issued a certificate by the State Board of Education (Chapter 166 – Teachers and Superintendents).
The board of education will evaluate the performance of the superintendent annually and if not satisfied with their improvements to schools, their 3 year contract will not be renewed (Chapter 166 – Teachers and Superintendents).
For schools, they must have regular contact with all parents, flexible parent-teacher conferences, drop-in hours for parents. In regards to textbooks, schools also must make rules for the control of school library media centers, including Internet access and content, and approve the selection of books and other educational media (Chapter 170 – Boards of Education).
CEA and Teacher Salaries
- What is the CEA?
The Connecticut Education Association (CEA) is a teacher union that advocates for legislation at the state and federal levels, represents the rights of teachers, and works with state policymakers to continue to elevate the teaching profession and promote public education (Connecticut Education Association).
- Average teacher salary (2022): $65,653 (Salary.com).
- Merit pay in state (2019-2020): $47,000 (TEACH.org).
- Teacher evaluation methods: blue represents student learning objectives, red represents standards-based observations of instruction, yellow is parent or peer feedback, and green is the student feedback or whole-school measures of student performance (CT.gov).

Color representations represented in the caption above.