Education in Hawaii
By Sophie Brett

Basic information
Unlike in other states, where education is somewhat controlled by local governments, Education in Hawaii is completely controlled by the state government. There is only one school district in the state, and schools at levels are financed from the state government. (Hawaii.gov) 88.3% of education funding comes from the state in Hawaii, while the US average for for state education funding is 46.7%. The state operating budget for the 2020 fiscal year was 2.1 billion, with 82% of it coming from i state tax revenue funds. Hawaii school system consists of 292 total schools, with 256 of these being public schools. In Hawaii, compulsory education is required from age 5-18, while many other states start requiring education at age 6/7 and stop requiring it at age 16/17. (NCES)
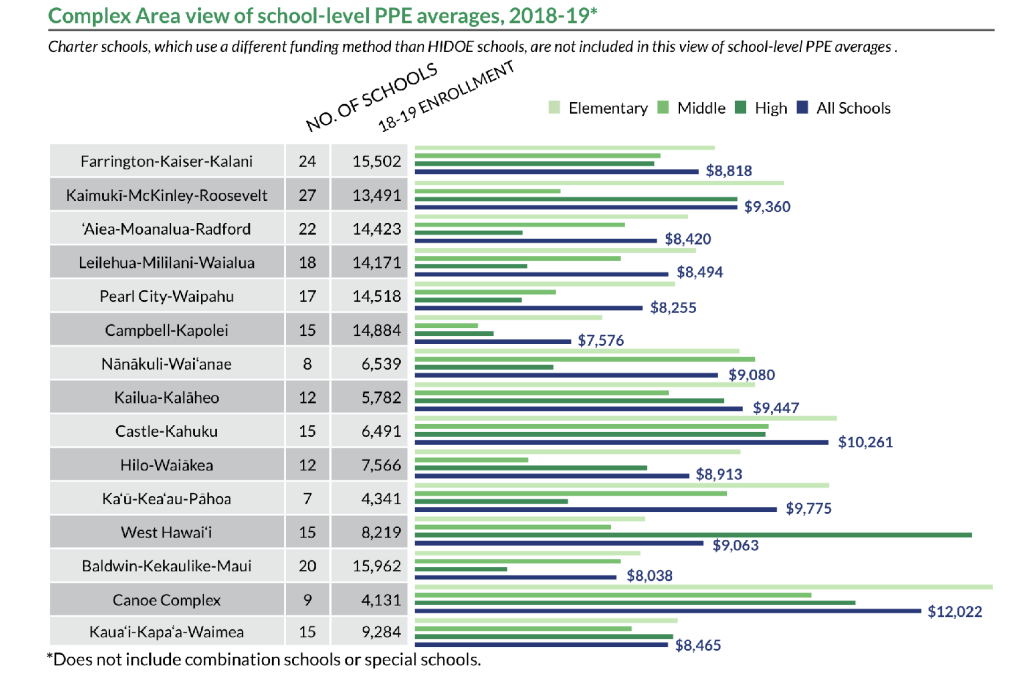
Per Pupil Expenditure (HPS)
- In FY 2018, the Hawaii average per pupil expenditure is $15, 242, while the US average is & $12, 612.
Student Demographics (from 2020 school year)
- Total Student Enrollment: 179,331
- 47% of students are eligible for free/reduced school lunch
- The Median household income of students is $80, 200, which is one of the highest in the country compared to $61,900 national average.
- 17, 960 students receive special education services, while 48% of these students are in general education classes most of the day (Hawaii Public Schools)
Student Racial/Ethnic background
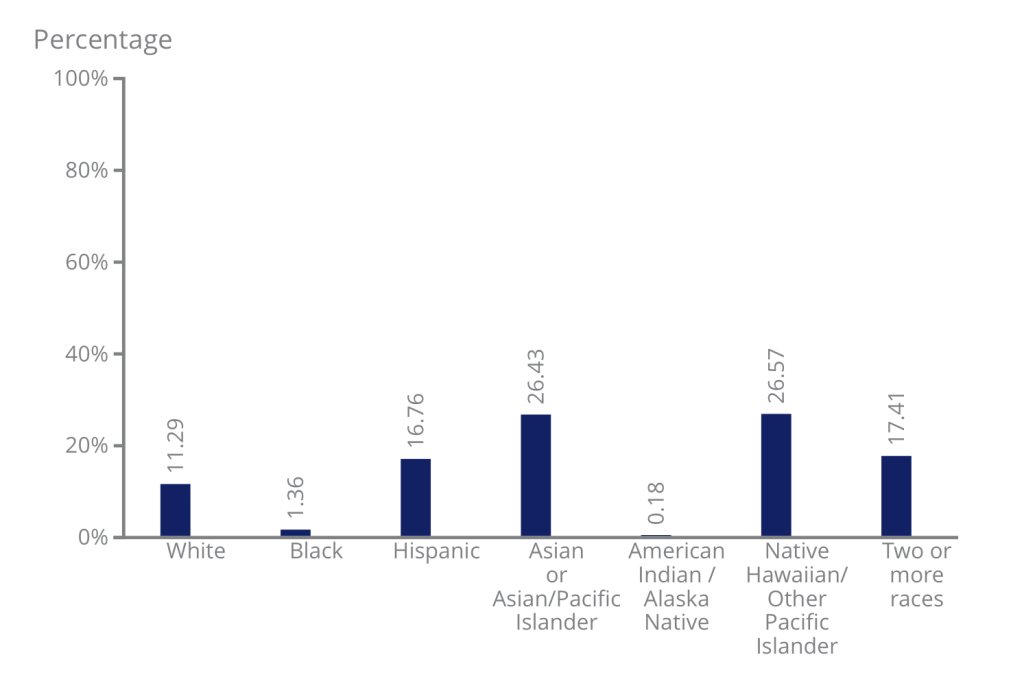
Graph from the Nations Report Card
Other schools
Private Schools
- In 2014-2015 private school enrollment was 45,600, with 35,310 HS graduates being from public schools. The number of private school students is projected to drop 6.8% by 2029.
Charter Schools
- Charter schools in Hawaii consist of 12.3% of all total schools, with 6.2% of enrollment going to charter schools. The enrollment of charter schools is slowly, but steadily growing.

- The percentage of race/ethnicity differs significantly when you compare charter schools to traditional schools. Charter schools tend to have significantly higher percentages of White and Pacific Islander students, and less Black, Asian, and two or more race students.
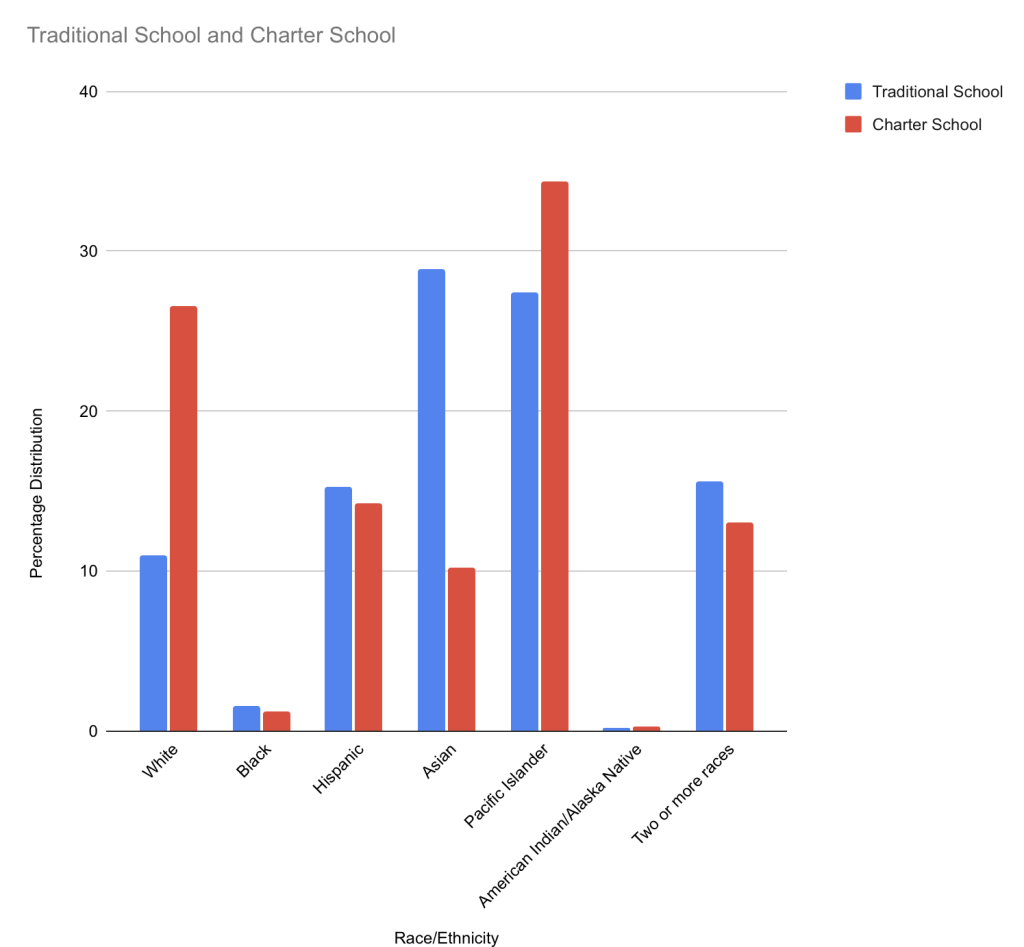 (NCES Data, chart created through Google Sheets)
 - Student achievement rates in traditional public schools and charter schools are similar. The only area where there is a statistically significant different between students is in Grade 8 reading, where students in charter schools score significantly higher. This is different than results throughout the entire US, because on average charter schools have lower levels of student achievement. (Nations Report Card)
- The State Public School Charter School Commission, whose structure is outlined below, oversees charter school operations in Hawaii.
 Chartercommmision.Hawaii.gov
College Admissions Exams
- In 2019, 54% of students took the SAT, and the mean score was 1100, which is slightly higher than the national average of 1059. For the evidence-based reading and writing, the HI mean score was 550 compared to the US mean of 531. The mean Mathematics score was also 550 compared to the US mean of 528. The standard deviation of Hawaii student scores were significantly lower than the US average or the averages for other states. This could be due to more standardization in schooling, since there is only one district in the state.
- In 2019, 80% of students took the ACT, which is down from 93% in 2015. In 2019, the average composite score was 19.0, which is lower than the national average of 20.7. Score gaps in the English, Mathematics, Reading, and Science sections were 2.2, 1.2, 2.0, and 1.4 respectively.
NCES
Graduation
- In Hawaii, 24 credits are required to receive a standard diploma, which is one of the highest amount of credits necessary to graduate in the country. However, no exit exam is necessary and there are alternative pathways in which students can earn credits if traditional standards are not met.
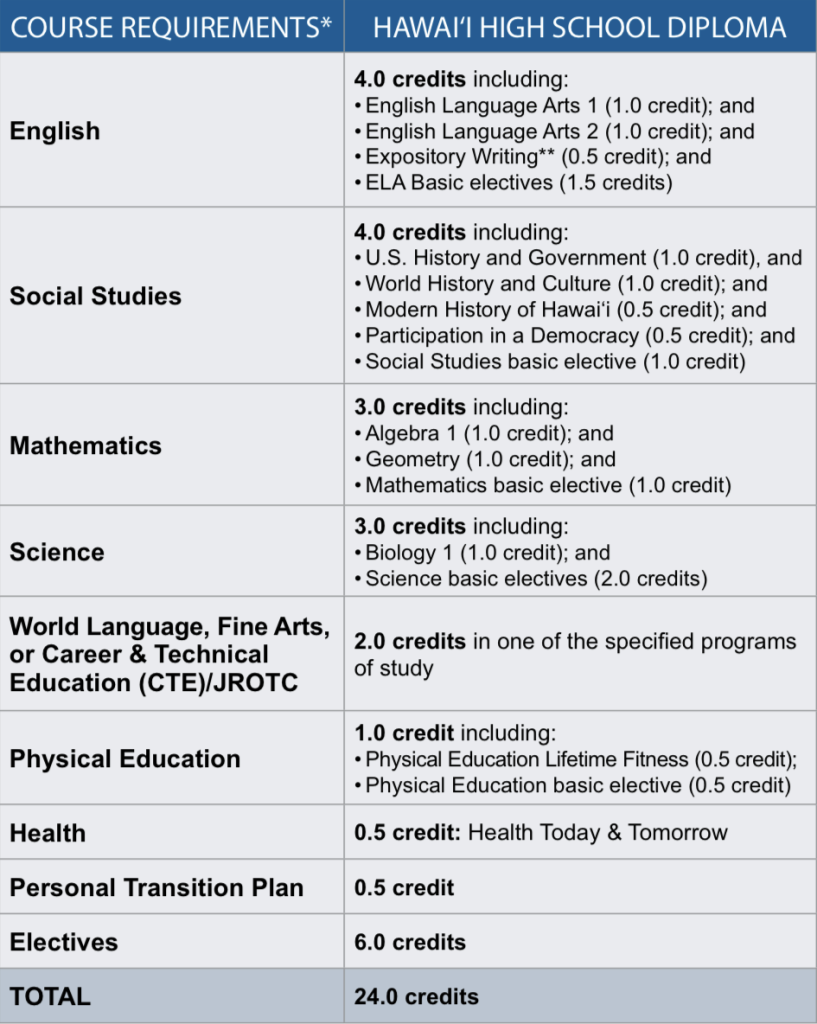 HPS
HPS - The high school graduation rate in Hawaii is 85%, which is comparable to the nationwide graduation rate on 86%
- 2018-2019 gradution rates by demographic
- White: HI 84%, US 89.4%
- Black: HI 83%, US 79.6%
- Hispanic: HI 85%, US 81.7%
- Asian: HI 93%
- Pacific Islander: HI 78.5% (US 92.6% for Asian/Pacific Islander)
- Economically disadvantaged: HI 80.7%, US 80.0%
- Limited English Proficiency: HI 70%, US 69.2%
- Students with disabilities: HI 63%, US 68.2%
- Homeless enrolled: HI 63%
- Foster Care: HI 44%
NCES for section above
Teachers
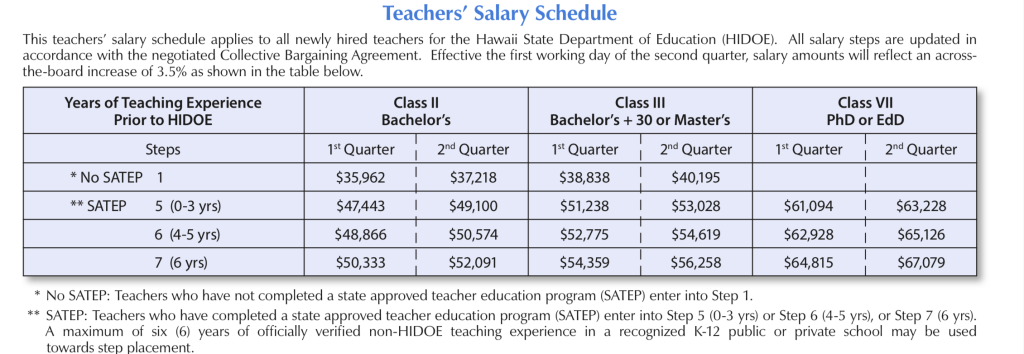
- The average annual salary for teachers in Hawaii is $57, 886, compare to the US average of $60, 483. NCES Teaching pay in Hawaii is standardized based on teacher experience and level of education. (Chart from HPS)
- In order to get an initial teaching certification, teachers need to complete a Basic skills exam and subject matter exam, but there is not assessment of teaching performing or teaching exam require (NCES)
- In 2020-2021, 93% of teaching positions in Hawaii were filled, and there was a 51% teacher retention rate. The retention rate dropped 4% from 2019-2020, possible due to increased responsibility of teachers during because of the COVID-19 pandemic. (HPS)
- The Hawaii Department of Education uses the Educator Effectiveness System with their teachers. The EES emphasizes student success, and ensures that teachers have adequate support that enables them to teach students effectively. For each teacher’s annual effectiveness rating, half of it is based on Student Growth and Learning, while half of it is based on Teacher Practice. The Teacher Practice portion is based on 40% Core Professionalism, and 60% Observation (for classroom teachers), and Working Portfolio (for non-classroom teachers). The Student Growth and Learning portion is based on Student Success Plans for classroom teachers, or School System Improvement Objectives for non-classroom teachers. These criteria are used to rank teachers as highly effective, effective, marginal, or unsatisfactory. All teachers are subject to this criteria, but to what degree depends on their experience and prior history. Tenured teachers are cycled through on cycle once every five years, but when they are off cycle, they are expected to focus on professional development. For on-cycle teachers, the degree to which they participate in the ESS varies based on experience and probationary status, but it usually consists of one SSP or SSIO, one-two formal observations or 4 reflections on student survey and MGP results. (EES website)
Teachers Unions
- Hawaii State Teacher’s Association (HSTA): Over 13,700 teachers are a part of the HSTA, and it exists as Hawaii’s primary teacher’s union. The HSTA is an affiliate of the National Education Association, and its Mission Statement is outlined below
- “Support and enhance the professional roles of teachers;
- Advocate teachers’ interests;
- Collaborate with all segments of the community to assure quality public education for Hawaii’s youth; and
- Promote human and civil rights to support and nurture diversity in our multifaceted community.” (HSTA website)
- Hawaii Foundation for Educators (HFE): The HFE is a subset of the HSTA that is focused on professional development and training, leadership development, and research and innovation for teachers. Many HSTA courses focused on these topics are funded by the HFE (HSTA website)
- Hawaii Education Association (HEA): The HEA is the longest standing advocacy group for teachers, and has “been dedicated to affirming the professionalism of Hawaii’s teachers and supporting excellence in education.” (HEA website)
- Education Institute of Hawaii (EIH): serves as a education think tank in Hawaii aiming to create the ideal public school system. It focuses on educating stakeholders on the best education practices in order for them to be able to enact reform. (EIH website)
Inequity:
Even though education in the US is free, not all kids receive the same education, and Hawaii is not an exception. Many children attend private or charter schools, which have differing levels of student achievement. Furthermore, students may have a harder time achieving the same level of success on assessments depending on their background. Discrepancies exist throughout the country between high need students, such those who are economically disadvantaged, special needs or English Language Learners, and other students. This discrepancy is true in all states, and quite large in Hawaii, where there is 34 point achievement gap in ELA, and a 29 point math achievement gap.
The Hawaii Board of Education has attempted to address these inequalities by providing increased funding for schools serving these children. The weighted student formula is established by a committee on these weights and helps to do this. Different weights levels given to high need students, with 3 different levels given to English language learners with different levels of proficiency. When the committee on weights last convened, they requested to increase support for English language learners and homeless students, as well as double the neighbor island weighting factor to 0.008. Doing this would help to ensure that schools can support the needs of these students. With extra funding for high-need students, it will help to decrease the achievement gap an make sure that all students in the public school system have equal chances for success. (Hawaii state department of education)
More information on the Weighted Student formula
”55 by 25 Goal”
Link to citation page: