National average per-pupil expenditure for public schools
$14,360 [1][5]
Indiana average per-pupil expenditure
$11,265 [1]
Total state public education budget
$10,962,029 [1]
High vs. low per-pupil expenditure (19/20)
Dekalb County, Eastern Community School District- $29,731 [5]
Randolph County, Union School Corporation- $5,339 [5]
Graduation Rate by Demographics (18/19)
[6]
Student Testing and Graduation Requirements
ILEARN test [7]
The ILEARN test “measures the range of Indiana Academic Standards”
The test measures English/Language Arts for grades 3-8, Mathematics grades 3-8, Science 4-6, and Social Studies for grade 5
The test also includes content area literacy, media literacy, listening, and computer science standards
ISTEP+ test
Indiana Statewide Testing for Educational Progress-Plus (ISTEP+) is an assessment that measures student achievement in Mathematics and English/Language Arts. ISTEP+ is used as the Graduation Qualifying Examination for students in graduation classes 2019-2022 [8]
ISTEP+ has now been replaced by the ILEARN test for all graduating classes following 2022 [8]
Highschool testing requirements[8]
Testing or proficiency graduation requirements
To earn an Indiana Diploma, students in the graduating classes of 2019 – 2022 must meet course and credit requirements and pass the Graduation Qualifying Exam (GQE), qualify for a GQE waiver, or complete the separate Graduation Pathways [9]
School Accountability
There must be State measured progress toward long-term goals and measurements of interim progress [10]
Identify schools for targeted support and improvement based on data from the previous school year [10]
Any school that is identified for targeted support and improvement will maintain that designation in the following school year, execute its support and improvement plan, and receive the necessary support and interventions from the state [10]
Schools will also be given a grade of A-F based on test scores and other factors related to performance. [10]
[11]
Adoption of Common Core and Next Generation Science Standards
Core 40 became Indiana’s[12] required high school curriculum in the fall of 2007. Students entering high school since 2007 have been expected to complete Core 40 as a graduation requirement. [12]
Indiana is one of twenty-four states that have developed their own standards based on recommendations in the NRC Framework for K-12 Science Education. [12]
Teachers and Teacher Accountability
Average teacher salary
$52,194 [1]
Presence of teachers unions/collective bargaining
Indiana has the Indiana State Teachers Association (ISTA) which is an affiliate of the National Educators’ Association (NEA) which is the largest teachers’ union in Indiana. Some Indiana teachers are also members of the American Federation of Teachers (AFT).
NEA/ISTA- 40,000 members [13]
AFT- 4,000 members [14]
65.4% of 71,867 total instructional staff in unions [15]
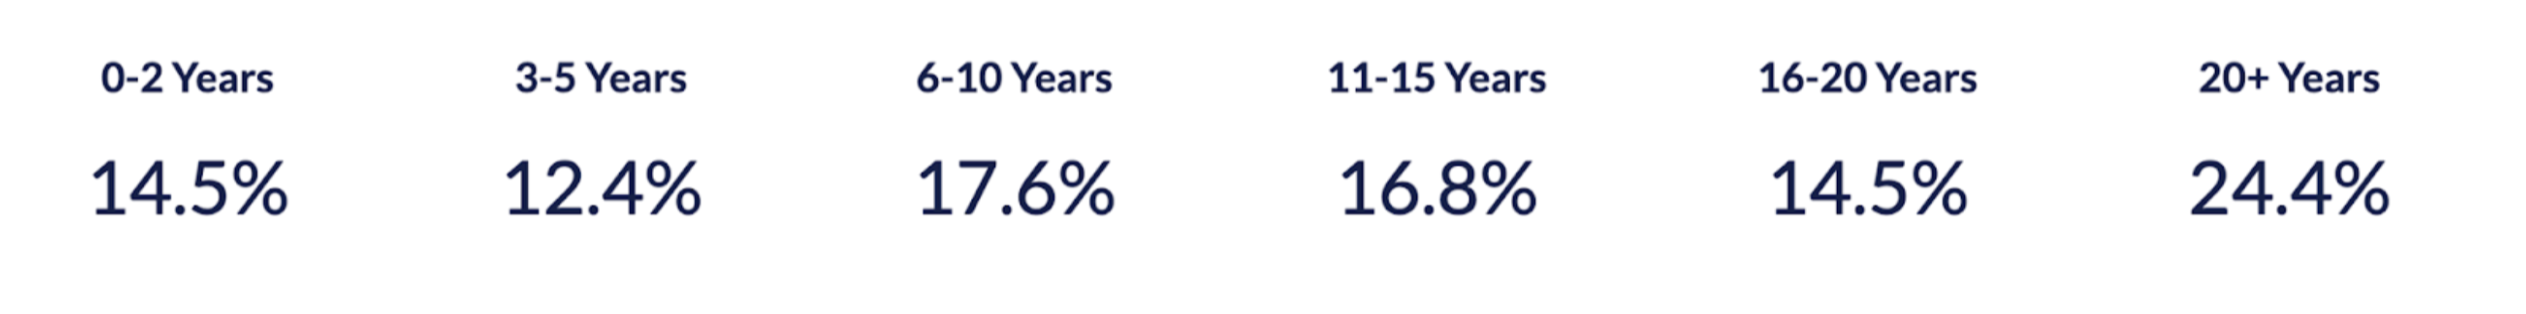
Average teaching age
[16]
Teacher evaluation methods and measures
The Indiana Department of Education (IDOE) released RISE 3.0 as a model plan for teacher and principal evaluations [17]
Merit pay for teachers
No statewide merit pay standards
Teacher evaluations (RISE 3.0) are factored into wages depending on the district [18]
Charter Schools and Private Schools
Number of charter schools and percentage of students served
120 charter schools serving 5% of students [19]
Voucher dollar amounts and percentage of students served[20][20]
The average school choice student is of white ethnicity, from a metropolitan area, from a household with a size of 4.75 people, and an income of $68,199.83 [20]
The average actual award amount is $5,439.23 and the average tuition and fees amount is $6,634.98 [20]
Permissible voucher use
Permissible voucher use is allowed for the 330 schools participating in the Choice Scholarship Program. [20]
Over 90% of the private schools participating in the Choice Scholarship Program are religious. [21]
*All statistics 20/21 unless noted otherwise
Statewide Funding Inequality
The most apparent statewide inequalities in Indiana’s schools is the disparity between per-pupil school expenditure. The difference between the highest per-pupil expenditure ($29,731) and the lowest ($5,339) is around $25,000 between the districts. The lowest per-pupil expenditure school districts are also many of the lowest-earning districts with the highest rates of poverty (see Indiana poverty rates on left vs. per-pupil expenditure on right).
As a result, students with the most financial support from their families and benefit from economic stability also are receiving the greatest funded education at their schools in general. The issue comes back to the structure of school funding in America.
States provide 47 percent of the budget for elementary and secondary schools (income taxes, corporate taxes, sales taxes, and fees)
Local districts contribute around 45 percent (generally from local property taxes)
The federal government provides approximately 8 percent of state education budgets
Indiana has attempted to push property tax reform since 2008 when they capped local property tax rates. However, this change was only followed by school districts across Indiana to release over 188 referendums to raise additional operating dollars for their own schools. Wealthy districts easily gained voter approval for the referendums, while lower-income districts have been unable to raise those revenues. As a result, the spending gap between the wealthiest and poorest schools and districts has grown from 38% to 53% over the past decade [23].
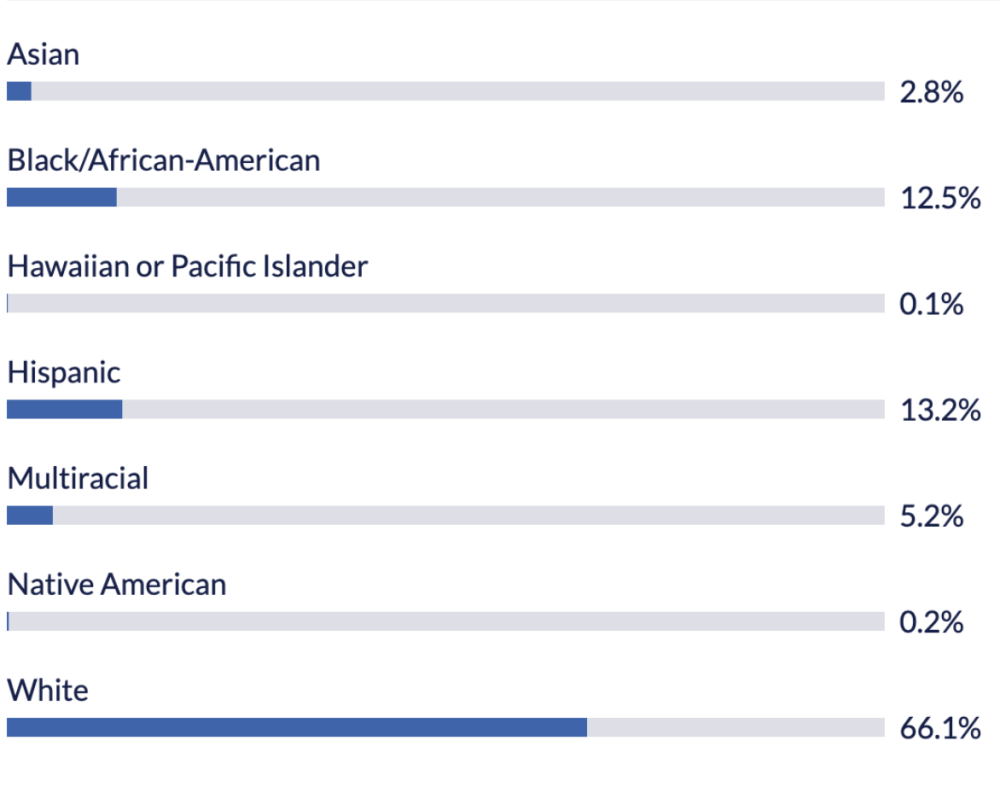
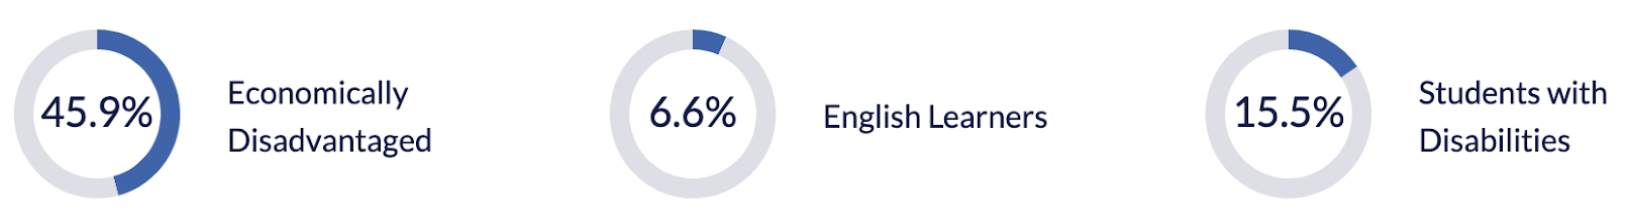
Economically disadvantaged students have an 83% graduation rate in Indiana which is 4% below the total state average graduation rate. In addition, minorities are disproportionally affected by the local funding inequality, and Black (77%) and Hispanic (84%) students have a graduation rate significantly lower than the total state average of 87%. Local funding inequality is a significant factor contributing to this achievement gap as it greatly impacts the availability of resources to the local schools and thus the quality of their education [6].
School Choice Expansion
In February 2021, legislation that would expand the eligibility of state-funded private school vouchers to families with double the state’s median income passed out of the House by 61-36. House Bill 1005 would increase eligibility in the Choice Scholarship Program from low and middle-income families to a family of four with an annual income of around $145,000 while the state’s median family income is nearly $74,000 [24].
A family of three can thus have an income up to $120,500 and still qualify, and a single-parent, single-child household can have an income up to about $95,700. In addition, under current law, families that had incomes on the higher end of the eligibility spectrum could get a voucher for 50% of the amount of money per child that their neighborhood public school gets from the state, while families on the lower end got 90%. Under the new law, all families that are eligible will get a voucher for 90% [21].
[20]
Expanding school choice scholarships access to higher-income families lowers the availability and financial support going to the students who are most in need. As seen in the table above, students with household incomes above $100,000 only made up 7% of the Choice Scholarship recipients in the 2020/21 school year. When compared to the 2021/22 school year, household incomes above $100,000 made up 20% of the Choice Scholarship recipients which is around a 13% increase [20]. The effects of House Bill 1005 will likely amplify this growth thus neglecting the original intent of the Choice Scholarship Program, which was to serve students in “failing school districts”.
In addition, many families who are already paying to send their children to private school will be able to qualify for the Choice Scholarship Program. Of all the private schools available to students in Indiana, over 90% are religious and thus the bill will also increase the number of tax dollars going toward private religious education [21].
School choice and vouchers have been proven to not be a solution to the disparities that exist between low-income and wealthier students. By implementing this bill, the voucher program will be perpetuating socioeconomic inequality; not stopping it.
Works Cited
“Rankings of the States 2020 and Estimates of School Statistics 2021,” National Education Association, 2021. https://www.nea.org/sites/default/files/2021-04/2021%20Rankings_and_Estimates_Report.pdf.
“Characteristics of Private Schools in the United States: Results From the 2019–20 Private School Universe Survey,” National Center of Education Statistics, U.S Department of Education, 2021. https://nces.ed.gov/pubs2021/2021061.pdf.
“How diverse is the state?” Indiana Department of Education, Accessed March 5th, 2022. https://inview.doe.in.gov/state/1088000000/population?student_group_id=homeless#enroll-subgroup-trend.
“How are various groups represented?” Indiana Department of Education, Accessed March 5th, 2022. https://inview.doe.in.gov/state/1088000000/population?student_group_id=homeless#enroll-subgroup-trend.
“Next Level Teacher Compensation Commission,” Indiana Department of Education, Accessed March 5th, 2022. https://www.in.gov/gov/teachercompensation/.
“Public high school 4-year adjusted cohort graduation rate,” National Center for Education Statistics, Digest of Education Statistics, 2021. https://nces.ed.gov/programs/digest/d20/tables/dt20_219.46.asp.
“ILEARN,” Indiana Department of Education, Accessed March 4th, 2022. https://www.in.gov/doe/students/assessment/ilearn/.
“High School Assessment,” Indiana Department of Education, Accessed March 6th, 2022. https://www.in.gov/doe/students/assessment/high-school-assessment/.
“Diploma Requirements,” Indiana Department of Education, Accessed March 6th, 2022. https://www.in.gov/doe/students/graduation-pathways/diploma-requirements/#:~:text=To%20earn%20an%20Indiana%20Diploma,if%20offered%20by%20the%20school).
“2020-2021 Indiana Accountability Waiver,” Indiana Department of Education, Accessed March 5th, 2022. https://www.in.gov/doe/files/2020-2021-indiana-accountability-waiver.pdf.
Jennifer McCormick, “Indiana Student Centered A-F Accountability System,” Indiana Department of Education, Accessed March 5th, 2022. https://www.in.gov/doe/files/f-accountability-presentation.pdf.
“Flexibility from Indiana Graduation Requirements in Response to COVID-19.” Indiana Department of Education. Accessed March 1st, 2022. https://www.in.gov/doe/files/2020-graduation-requirements-final-4220.pdf.
“Our Association,” Indiana State Teachers Association, Accessed March 20th, 2022. https://www.ista-in.org/our-association.
“AFT Leadership,” American Federation of Teachers, 2020. https://www.aft.org/about/leadership/gleneva-dunham#:~:text=AFT%20Vice%20President,members%20in%2024%20local%20unions.
“Percentage of public school teachers who indicated that they were members of a union,” National Center of Education Statistics, Accessed March 14th, 2022. https://nces.ed.gov/surveys/ntps/tables/ntps1718_20111201_t1s.asp.
“How experienced are Indiana educators?” Indiana Department of Education, Accessed March 25th, 2022. https://inview.doe.in.gov/state/1088000000/educator.
Rebecca Estes, “RISE 3.0 State Model Plan for Teacher Evaluations Release,” Indiana Department of Education, 2020. https://www.in.gov/doe/files/rise-model-plan-release-memodocx.pdf.
“A Roadmap for Improving Indiana Teacher Compensation,” Indiana Department of Education, Accessed March 20th, 2022. https://www.in.gov/gov/files/Teacher-Pay-Report-FINAL.pdf.
“Public Charter School Enrollment,” National Center for Education Statistics, Accessed March 20th, 2022. https://nces.ed.gov/programs/coe/indicator/cgb#suggested-citation.
“Choice Scholarship Program Annual Report,” Indiana Department of Education, Accessed March 19th, 2022. https://www.in.gov/doe/files/2021-2022-Annual-Report-0428-Final.pdf.
Margaret Menge, “Indiana expands school voucher program to include most middle-class families,” The Center Square, 2021. https://www.thecentersquare.com/indiana/indiana-expands-school-voucher-program-to-include-most-middle-class-families/article_32683b9a-a47b-11eb-a897-f3fa80ecee15.html.
Elizabeth A Dobis, “Dimensions of Indiana Poverty,” Indiana Business Review, Accessed May 4th, 2022. https://www.ibrc.indiana.edu/ibr/2019/fall/article1.html.
“Examination of Indiana’s School Funding System Finds Gaps Based on Students’ Income, Race and School Type,” Richard M. Fairbanks Foundation, 2020. https://www.rmff.org/news-releases/examination-of-indianas-school-funding-system-finds-gaps-based-on-students-income-race-and-school-type/.
Eric Weddle, “School Choice Expansion Bill Approved By House Amid Contentious Debate,” WFYI Indianapolis, 2021. https://www.wfyi.org/news/articles/controversial-school-choice-expansion-bill-approved-by-house.


 As a result, students with the most financial support from their families and benefit from economic stability also are receiving the greatest funded education at their schools in general. The issue comes back to the structure of school funding in America.