David Garcia
State Overview:
Total public school student population: Approximately 224,462 (Frisbie, 2022)
Per pupil expenditure on average and per district:
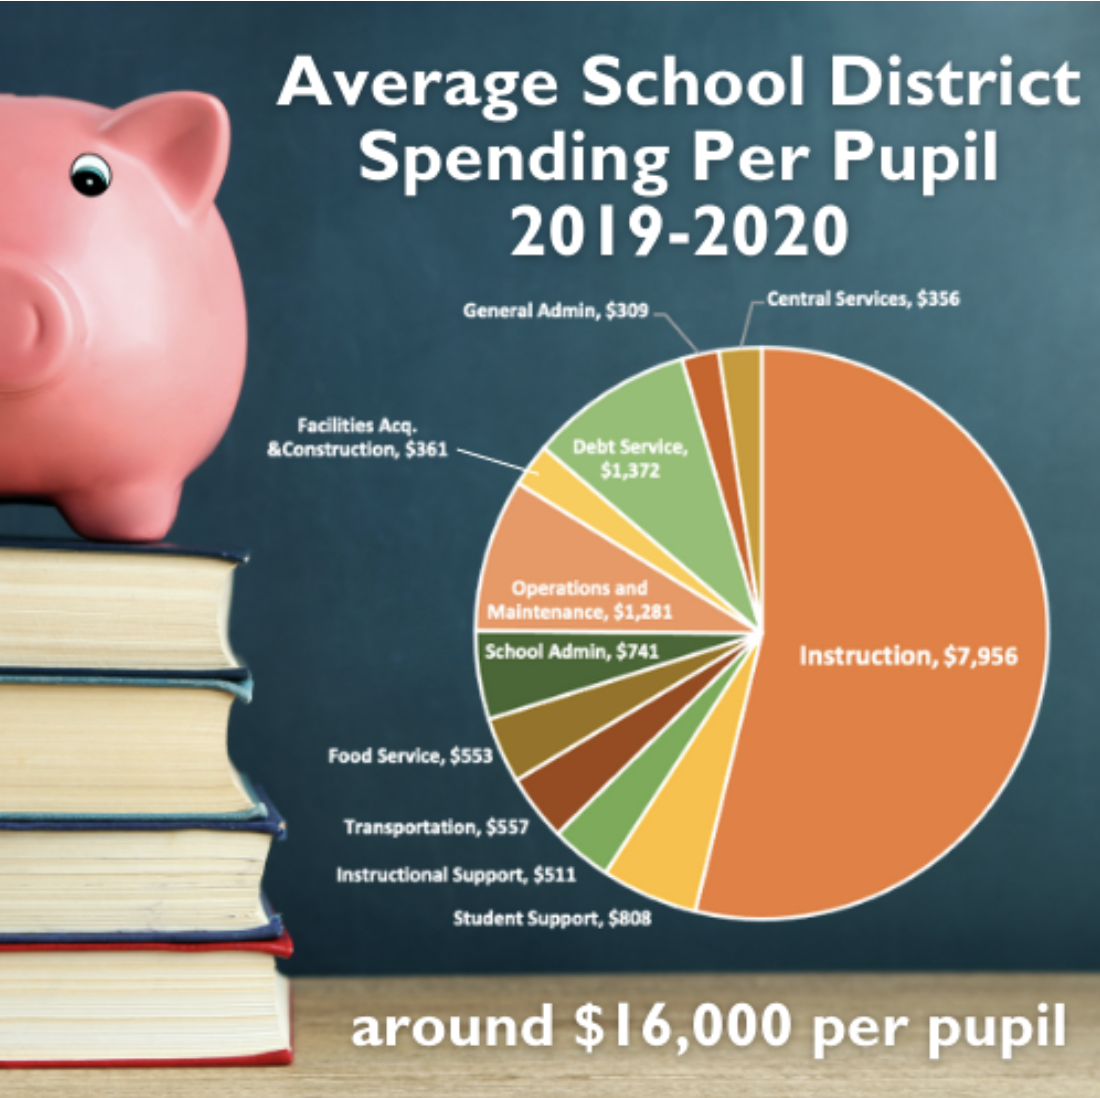
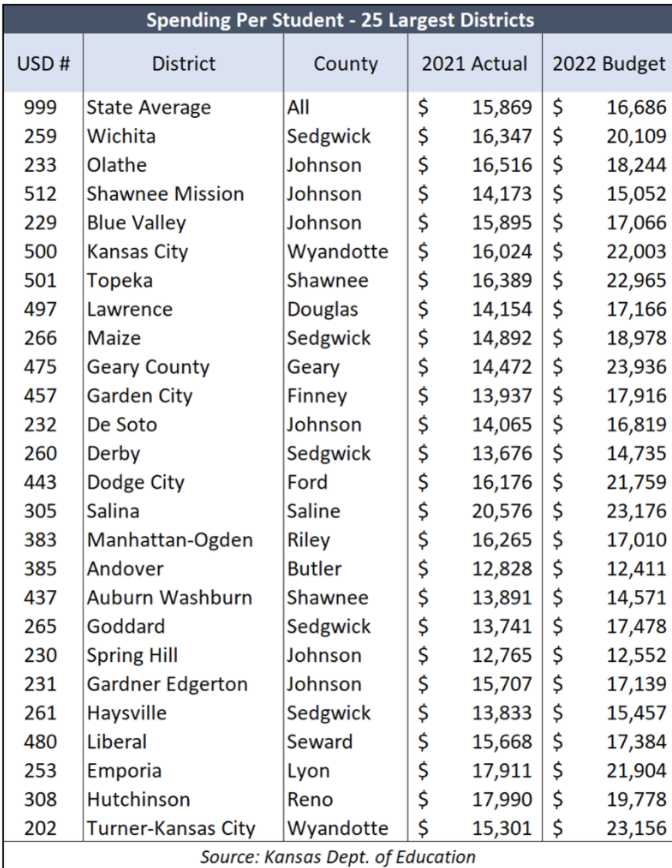
- The average spending per pupil is around $16,000. However, this may vary drastically from county to county. For example, Geary County with a budget of $23,936 is much higher than the budget of $12,411 in Andover County (Kansas Association of School Boards) (Kansas Policy Institute 2022).
Average national per pupil expenditure: $12,624 per pupil
Student Demographics (race/ethnicity, English Language Learners, poverty rates): 8.5% ELL, 18.3% students in poverty
- Poverty in Kansas is of higher frequency than the 14.4% of students nationally in poverty (Kansas Poverty Rate)

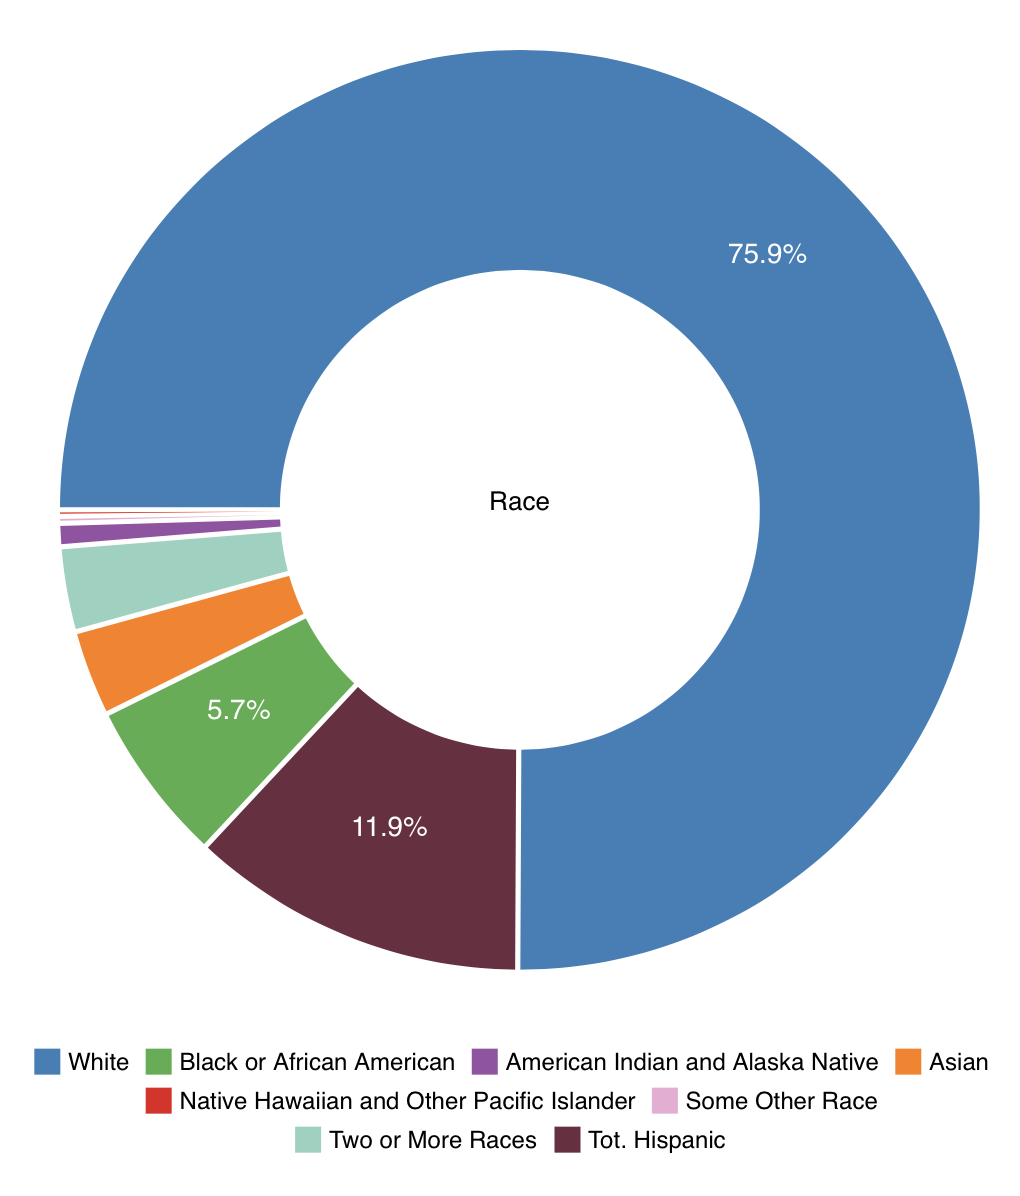
- Even though a fourth of the Kansas population consists of children of color, they are significantly more likely to experience poverty (Haider 2021)
Graduation Rates (%):
- 88.1 Total
- 88.5 white
- 78.9 black
- 79.5 hispanic
- 83.1 am indian, alaska native
- 86.1 Native hawaiian
- 93.9 asian
- 81.7 multi racial
- 74.5 free lunch
- 86.1 reduced-price lunch
- 79.6 spec educ
- 68.8 Homeless
- 81.4 migrant
- 82.6 LEP (Limited English Proficiency)
- (National Center for Education Statistics 2010)
Testing/proficiency graduation requirements: The Kansas Assessment Program assesses ELA, mathematics, and the sciences in assessments (Kansas Department of Education)
Average teacher salary: 44k-75k
Presence of teacher that are unionized: 54.7% of teachers. NEA and AFT get the majority of the affiliates (Edexcellencemedia).
Data Analysis
- Based on the data you’ve collected, why do inequities persist in your state? What evidence did you see of the state addressing or overcoming inequities?
Equity & Diversification Post-COVID

- Though Kansas has not been known for being the most diverse state in the past, several of its counties are diversifying over time (An Equity Profile of the Kansas City Region).
As is true with a large portion of the nation, the racial segregation of the past continues to influence the racial inequalities we still see the present. Although the father of the common school intended for education to be the great equalizer of humans back in the 1800s, it would be false to say that we have reached that already. Specifically, we can see in Kansas its disparity in graduation rates very clearly. Though Kansas lies above the national average graduation rate, with 88.1% of its students going on to graduate compared to 86% nationally, most POC fall short of it. Students identifying as black, hispanic, and multi-racial all fall 10% below white students when it comes to graduation rates (Ed.gov, 2010). On the other hand, Kansas as a whole falls below the national average when it comes to percent of students in poverty with it having 18.3% as opposed to 14.4% nationally. Blacks and hispanic children are more than double as likely to experience poverty in Kansas (Haider, 2021). As a result, it is much harder for those students to be able to keep up with class while having to deal with difficulties outside of their school life. As a result, it comes to no surprise that there is a .95 inverse correlation between poverty in a district and the ACT scores from the students (The University of Kansas, 2019).
COVID has only made the battle for equity more difficult. Fortunately, Kansas has made decisions to put itself in the right direction in the future. President Biden has acted to help out many schools across the nation with his Rescue Plan, in an effort to increase their budgets. Kansas has received $830,585,182 from the plan supporting a push to open schools for in-person learning (U.S. Department of Education). The pandemic has caused schools many economic strains with the rapid swap to technology enabling a remote model for schools. Chromebooks, laptops, and internet services all had to be rapidly acquired so that students wouldn’t get behind. The plan requires that at least 20% of the money package goes towards combating the learning loss or for equity opportunities for students of low income, POC, disabilities, and homelessness. (George, 2021).
With the average school district spending per pupil standing at around $16,000 per pupil, there is certainly variability in each district (Kansas Association of School Boards, 2022). For example, Wyandotte County will have a budget of $23,156 per pupil in 2022. This is a great increase from its previous year which was at $15,301. Interestingly, the Andover District actually went down in its budget per pupil from $12,828 to $12,411 from 2021 to 2022. What makes these two districts so different to influence their budget outcome? Andover District happened to have a large enrollment in their remote learning programs after COVID. As a result, there would be less costs per student considering that they would be doing their schoolwork at home, on their device (George, 2021). On the other hand, the population of Wyandotte County is around half minorities. 28% and 22% of which are impoverished African Americans or Hispanics. As a result, it makes sense that this district would need more money being spent helping the community from getting behind on their education (Sallee, 2020).
Looking at the other surrounding regions in Kansas, it seems that policy makers have decided to support growing diverse regions by increasing their funding in them as a result. Though POC in Johnson County currently make up less than 30% of its population, it is expected to increase to 40-50% by 2040. Interestingly, Johnson County districts have also gotten some of the greater budget increases ranging around $3,000. This diversification is not just a county-wide thing. POC growth is currently outgrowing the rate of population growth in every county of Kansas (Equity Profile of the Kansas City Region). The state as a whole is getting much more diverse. With the state’s clear focus on equity especially after COVID, it’s safe to say that Kansas’ policy makers are supporting the state’s more diverse future.
- Describe and analyze one particular trend or education-specific event in your state. Make sure to contextualize this trend or event within the big picture you’ve created from your data analysis.
Enrollment & Budget
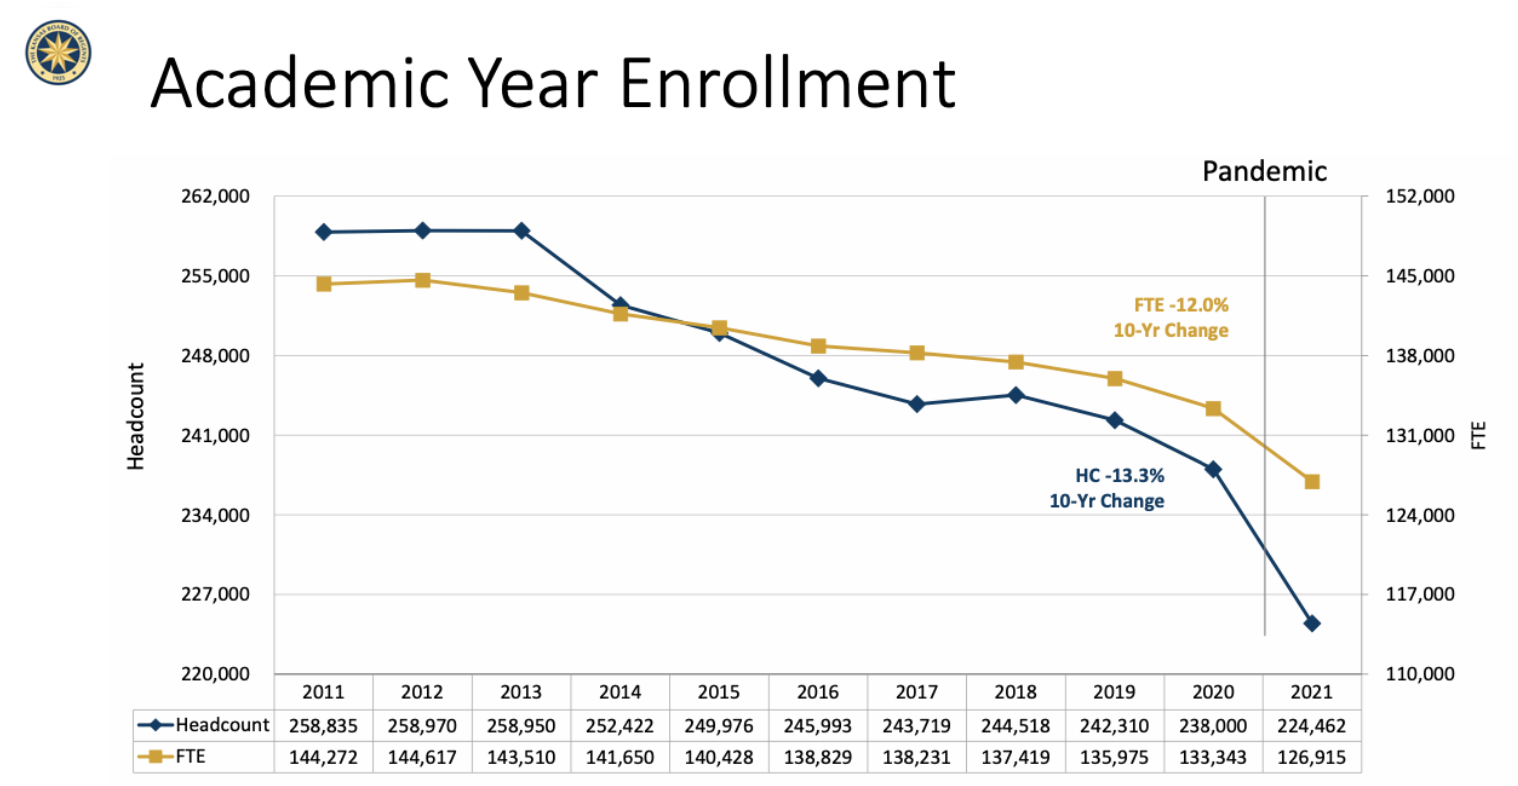
- The steepest drop in school enrollment has been from 2020 to 2021. This is likely partially as a result of the pandemic (Frisbie 2022).
Among many other things, the pandemic has made it particularly hard for schools across the nation to deal with its numerous issues in enrollment. As COVID has made countless schools make the switch to remote learning, less and less students are making the choice to continue enrollment. From 2019 to 2021, enrollment dropped from 242,310 all the way to 224,462 (Frisbie, 2022). With this being some of the toughest years for educators in the state in their lifetimes, we can also see that the impact has also reached the students and their ability to stay focused on their schooling. In addition to enrollment dropping, absenteeism in students has increased to 17.5% from 14% (Bahl, 2021).
Typically, the chosen school budget is based on the expected number of students it will end up being spent on. However, with so many students taking gap years during the 2020-2021 school year due to COVID or personal reasons, there are many difficulties in making an accurate school budget to fit an estimated school population. It is also important to take into account how some students have decided they will make the switch to virtual learning platforms (Garcia, 2021). As mentioned earlier with the Andover District, in regions where there has been a large virtual enrollment, in-person schooling has decreased as a result and so has their budget.
With the many difficulties that COVID has been causing for schools over the past few years, there has been a statewide push for greater school budgets this year. This strategy is also to prevent from having to ask taxpayers in the future for additional budget support if it turns out that there is more money needed to support children as they begin to switch to in-person learning (Garcia, 2021). With this increase in spending on the students of Kansas, is it likely that students will have the chance to transition better back to in-person learning and be more motivated to learn, which should bring back up the enrollment numbers in schools.
Citations:
- An Equity Profile of the Kansas City Region – Marc. https://www.marc.org/Regional-Planning/Creating-Sustainable-Places/assets/Kansas-City_Profile_23August2013.aspx.
- Bahl, Andrew. “’Still in the Middle of a Hurricane’: Teacher Vacancies Rise, Student Enrollment Falls in Kansas during Pandemic.” The Topeka Capital-Journal, Topeka Capital-Journal, 12 Oct. 2021, https://www.cjonline.com/story/news/education/2021/10/12/kansas-schools-enrollment-student-performance-teacher-vacancies-education-data-covid/6089449001/.
- Boards, Kansas Association of School. “Kansas Association of School Boards.” KASB News, https://www.kasb.org/45132?articleID=76997.
- Boards, Kansas Association of School. “Kansas Association of School Boards.” KASB News, https://www.kasb.org/45132?articleID=87853.
- Boards, Kansas Association of School. “Kansas Association of School Boards.” Www.kasb.org, www.kasb.org/45132?articleID=87853. Accessed 5 May 2022.
- Davis, Derek H. “Digitalgeorgetown Home.” DigitalGeorgetown Home, 1 Dec. 1999, https://repository.library.georgetown.edu/handle/10822/928797.
- Frisbie, Elaine. Enrollment Report. 2022.
- Garcia, Rafael. “Who Pays to Teach a Wichita Public Schools Student? the Entire State Does.” The Wichita Beacon, 5 Oct. 2021, https://wichitabeacon.org/stories/2021/08/12/how-kansas-school-funding-works/.
- George, Donna St., et al. “More than $1.8 Billion Flows into Schools in the Washington Region to Help amid Pandemic.” The Washington Post, WP Company, 26 Apr. 2021, https://www.washingtonpost.com/local/education/dmv-schools-federal-funds-billion/2021/04/22/ef4ca2ec-9e17-11eb-9d05-ae06f4529ece_story.html.
- Haider, Areeba. “The Basic Facts about Children in Poverty.” Center for American Progress, 12 Jan. 2021, www.americanprogress.org/article/basic-facts-children-poverty/.
- Hanson, Melanie, and Fact Checked. “U.S. Public Education Spending Statistics [2022]: Per Pupil + Total.” Education Data Initiative, 21 Mar. 2022, https://educationdata.org/public-education-spending-statistics.
- How Strong Are U.S. Teacher Unions? A State-by-State. http://edexcellencemedia.net/publications/2012/20121029-How-Strong-Are-US-Teacher-Unions/20121029-Union-Strength-Full-Report.pdf.
- Kansas Integrated Accountaiblity – Kansas State Department of Education. https://www.ksde.org/Portals/0/ECSETS/KIAS/KIAS-Overview.pdf.
- President, Julia Cusick Interim Vice, et al. “The Basic Facts about Children in Poverty.” Center for American Progress, 3 Nov. 2021, https://www.americanprogress.org/article/basic-facts-children-poverty/.
- Sallee, Patrick. “Poverty, Race, and the Covid Crisis in Wyandotte County.” Bloch School, 23 June 2020, https://bloch.umkc.edu/poverty-race-and-the-covid-crisis-in-wyandotte-county/
- “Department of Education Announces American Rescue Plan Funds for All 50 States, Puerto Rico, and the District of Columbia to Help Schools Reopen | U.S. Department of Education.” Www.ed.gov, www.ed.gov/news/press-releases/department-education-announces-american-rescue-plan-funds-all-50-states-puerto-rico-and-district-columbia-help-schools-reopen.
- “Kansas K-12 Data Report Generator.” Request Rejected, https://datacentral.ksde.org/report_gen.aspx?TSPD_101_R0=0812b43512ab20007c1fd11720598ff2e8fdc8cda4ac659893c4fb3b56faac9812d23e88cd6e28c90874af4644143000f290fc2cde8f2d4ff3b55ef2c6971b20ab2839e4b3ee13d058e05a934dc859386557626a9c7e972d79ac02451cee3461.
- “Poverty in Kansas.” Kansas Poverty Rate, https://www.welfareinfo.org/poverty-rate/kansas/.
- “School Budgets Average $16,686 per Pupil This Year.” Kansas Policy Institute, 1 Feb. 2022, https://kansaspolicy.org/school-budgets-average-16686-per-pupil-this-year/.
- “Still Separate and Unequal.” The University of Kansas, 29 Oct. 2019, today.ku.edu/2019/10/29/report-shows-how-kansas-city-schools-have-maintained-segregation-through-geographic.
- “The NCES Fast Facts Tool Provides Quick Answers to Many Education Questions (National Center for Education Statistics).” Ed.gov, National Center for Education Statistics, 2010, nces.ed.gov/fastfacts/display.asp?id=805.