The Commonwealth of Massachusetts
Image: The Flag of the Commonwealth of Massachusetts [35].
This report details the facts and figures of education in the Commonwealth of Massachusetts as well as some current trends in the educational landscape of the state.
This report was compiled by Ari Bersch.
Facts and Figures:
- Total public school student population:
- The total public school attendance in Massachusetts in the 2021-22 academic year was 911,529 students [1].
- Total state public education budget:
- The total state public education budget in Massachusetts in 2020 was $18,142,490,480.89 [2].
- Average per pupil expenditure:
- The average per pupil expenditure in Massachusetts in 2020 was $17,575.17 [2].
- Average national per pupil expenditure:
- Meanwhile, the average per pupil expenditure in the United States in 2020 was $12,624, meaning that Massachusetts schools, on average, spend nearly half again as much as the national average in per pupil spending [3].
- High and low per pupil expenditure within state:
- The highest per pupil expenditure in a school district in Massachusetts is in Provincetown, which spent $45,463.56 per pupil in 2020 [4].
- The lowest per pupil expenditure in a school district in Massachusetts is in the TEC Connections Academy Virtual School District, which spent $10,290.32 per pupil in 2020 [4].
- The lowest per pupil expenditure in a school district in Massachusetts that represents a geographic area and offers in-person instruction is Dracut, which spent $11,381.99 per pupil in 2020 [4].
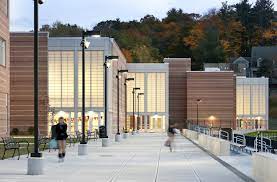
Image: Newton North High School, a well-funded and newly renovated school in Newton, Mass [36].
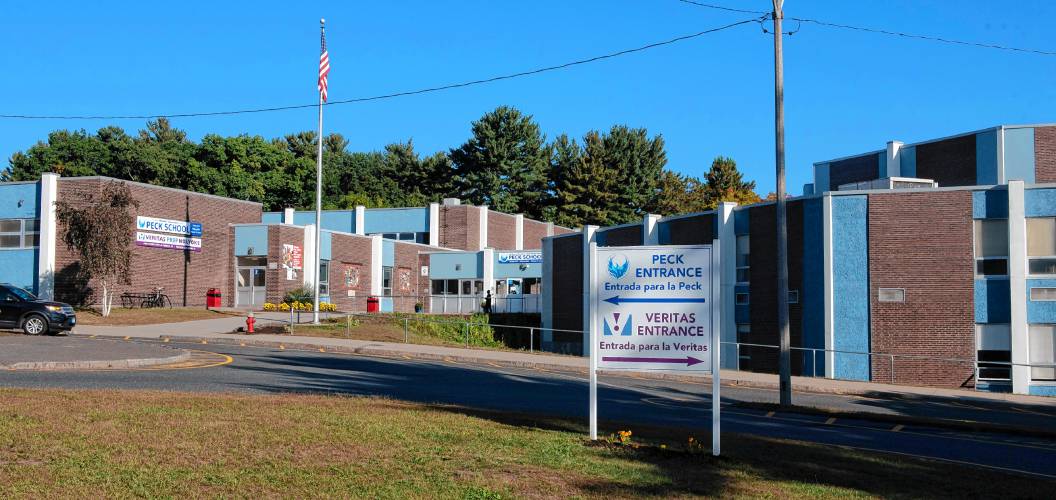
Image: William R. Peck School, a poorly funded school in Holyoke, Mass. The differences between the two schools are striking in these images and demonstrate the inequities that result from current school funding structures [37].
- Public v. private school attendance:
- In 2020-21, 91.2 percent of Massachusetts students attended public schools, 7.00 percent attended private schools, and 1.76 percent of students were homeschooled [5].
- From the total population, 4.54 percent of students attended charter schools (contained within the public school population) [5].
- Student demographics (race/ethnicity, English Language Learners, poverty rates):
- In the 2021-22 academic year, 9.3 percent of Massachusetts public school students were African-American, 7.2 percent were Asian, 23.1 percent were Hispanic or Latino, 0.2 percent were Native American, 55.7 percent were White, 0.1 percent were Native Hawaiian or Pacific Islander, and 4.3 percent were multiracial (non-Hispanic or Latino) [6].
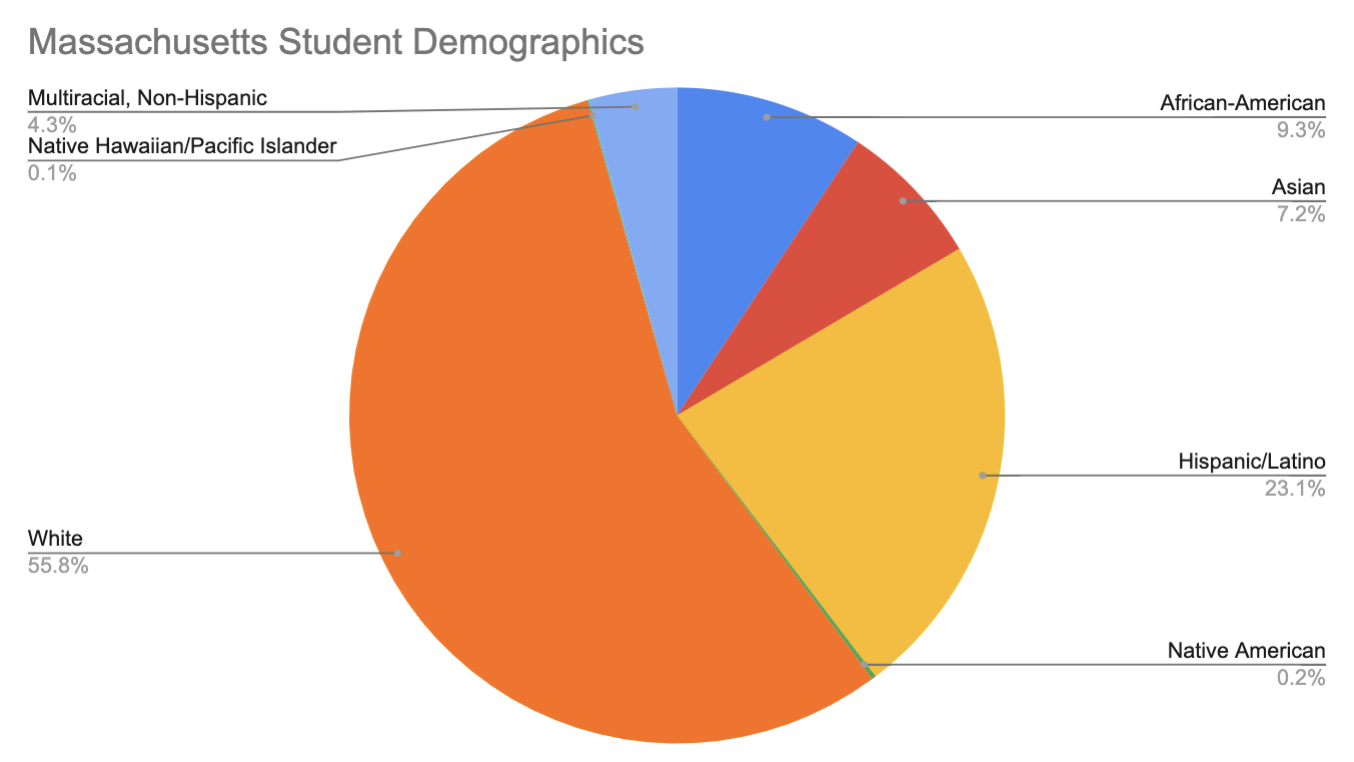
Image: Demographics of Massachusetts public school students.
-
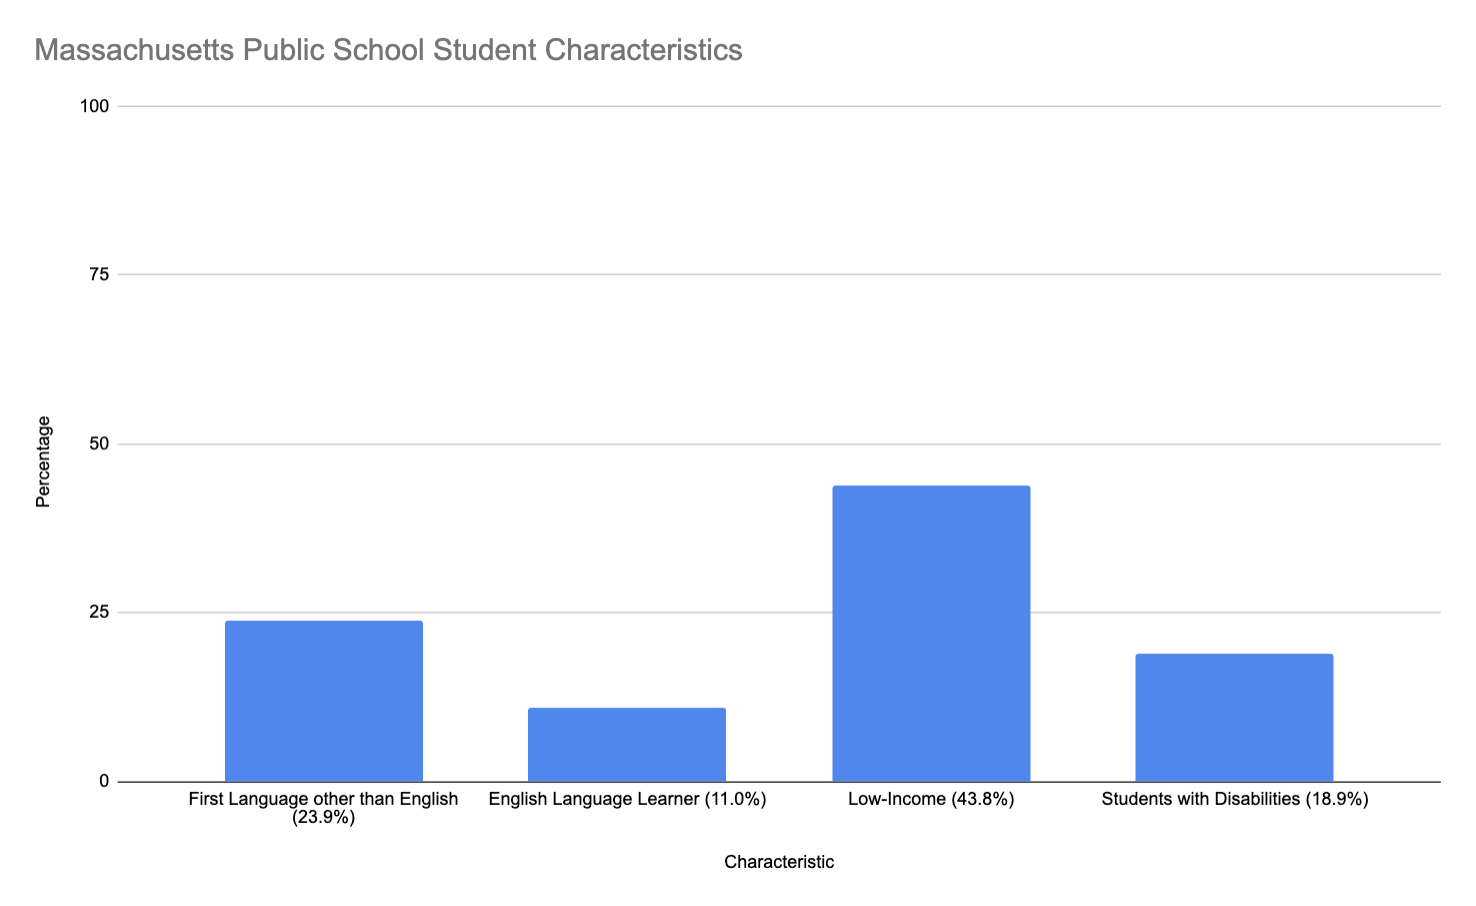
- In the 2021-22 academic year, 23.9 percent of Massachusetts public school students had a first language other than English, 11.0 percent were English language learners, 43.8 percent of students were low-income, and 18.9 percent are students with disabilities [7].
- In the 2021-22 academic year, 23.9 percent of Massachusetts public school students had a first language other than English, 11.0 percent were English language learners, 43.8 percent of students were low-income, and 18.9 percent are students with disabilities [7].
Image: Percentage of students with various characteristics in Massachusetts public schools.
- Graduation rates (total, and by demographics):
- In 2021, the four-year graduation rate across all Massachusetts public school students was 89.8 percent. For males, this figure was 87.4 percent, and, for females, it was 92.3 percent. English language learners graduated at a rate of 71.8 percent, while students with disabilities graduated at a rate of 76.6 percent [8].
- In 2021, African-American public school students in Massachusetts graduated at a rate of 84.4 percent, Asian public school students graduated at a rate of 96.1 percent, Hispanic or Latino public school students graduated at a rate of 80.0 percent, American Indian or Alaska Native public school students graduated at a rate of 82.3 percent, White public school students graduated at a rate of 93.2 percent, Native Hawaiian or Pacific Islander public school students graduated at a rate of 86.0 percent, and multiracial public school students who are not Hispanic or Latino graduated at rate of 88.8 percent [8].

Image: Graduation rates of Massachusetts students with various characteristics, compared to the statewide average.
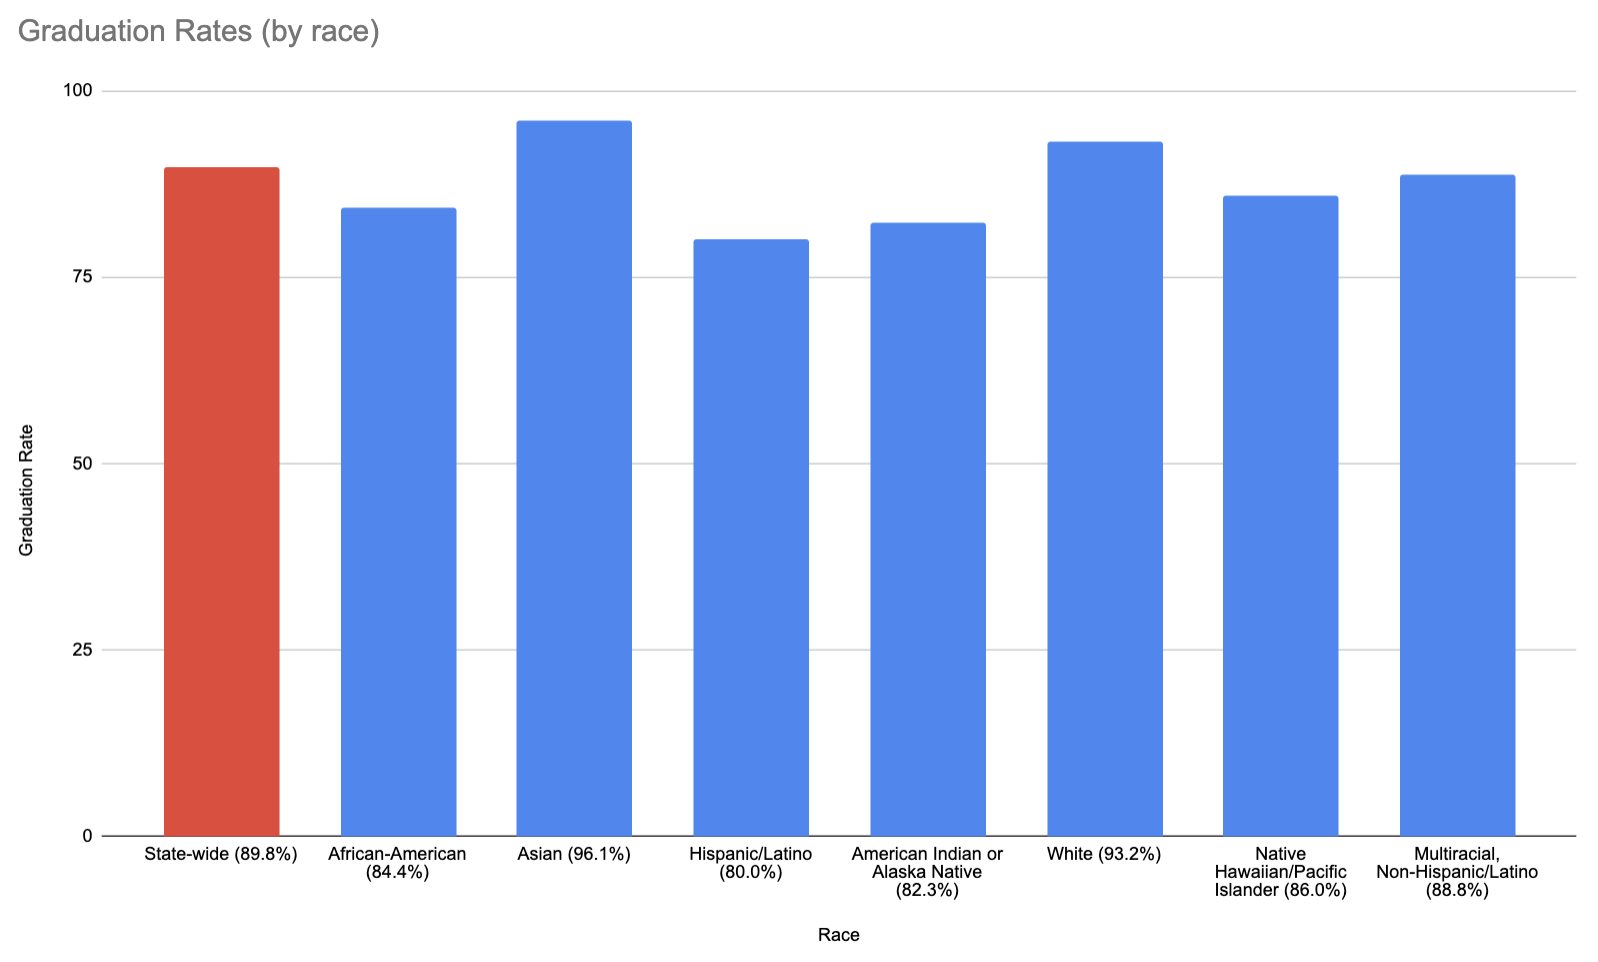
Image: Graduation rates of Massachusetts students by race, compared to the statewide average.
- Accountability measures (testing, portfolios, growth, etc.):
- The Massachusetts Comprehensive Assessment System (MCAS) is the primary accountability measure in Massachusetts. It consists of ELA, Math, and STE (Science, Technology, and Engineering) exams which students must pass in their sophomore year of high school in order to graduate from any public school in the state of Massachusetts. Students in grades 3-10 (excluding grade 9) must take the MCAS each year if they are enrolled in a Massachusetts public school, charter school, or private schools that receive special education assistance from the state [9].
- In 2009, the Massachusetts Department of Education implemented a system called MCAS Student Growth Percentiles (SGPs) to measure students’ growth in the subject areas assessed by MCAS. Before this system was implemented, MCAS only measured how students performed in comparison to statewide standards [10].
- Growth rates are reported as percentiles based on how much a student improved compared to other students who had the same score the previous year. For example, two students, one of whom scored a 210 (on a scale of 200 to 280) on the MCAS ELA test in fifth grade, and the other of whom scored 270, would both have an SGP of 55 in sixth grade if they performed better than 55 percent of their peers on the sixth grade MCAS ELA test [10].
- This system allows for the academic growth of students at all performance levels to be accurately measured between years [10].
- Subject matter assessed by accountability measures:
- The MCAS assesses students in English Language Arts (ELA) and Mathematics in the spring of grades 3-8 and 10. Students also take the MCAS STE exam in the spring of 5th and 8th grade. In high school, students take MCAS STE exams in biology, chemistry, introductory physics, and technology/engineering in the spring of the year that they take each subject [11].
- Consequences for failing to meet standards—for students, teachers, administrators, and schools:
- The vast majority of schools (85%) do not require state assistance based on their MCAS results. Out of the 15% of schools that do receive state assistance, there are two categories: (1) schools who are close to not requiring assistance and thus receive targeted support in areas of greatest need, and (2) schools who require broader, comprehensive state support [12].
- Support comes from the DESE (Department of Elementary and Secondary Education) in the forms of site visits by trained professionals, video series for educators and administrators, as well as evaluation reports with targeted feedback for specific educators and schools on the whole [12].
- Testing or proficiency graduation requirements:
- All students must meet the state’s “Competency Determination standard” in order to graduate. To do so, they have to pass the 10th grade MCAS (Mass. Comprehensive Assessment System) exams in English Language Arts (ELA), Math, and one exam in Science and Technology/Engineering [13].
- Students who fail one or more of the exams in 10th grade have chances to retake the MCAS in their final two years of high school, and there are also opportunities for students with learning disabilities––for whom the MCAS would not accurately reflect their abilities––to submit portfolios in order to reflect their knowledge instead [14].
- Standards have been modified for the high school classes of 2020-23 due to COVID-19 disruptions. There are also alternative requirements for students in active military families and those receiving special education services [14].
- State law also requires that all students learn American history and civics. While not required for graduation, students are recommended to complete the MassCore program of studies, which includes four years of English, four years of mathematics, three years of lab-based science, three years of history, two years of a foreign language, one year of an arts program, and five other classes in fields like finance, wellness, and technology. MassCore was designed and implemented to better prepare students for the workforce and allow students to take more advanced courses in college [14].
- Adoption of Common Core:
- Massachusetts adopted the Common Core in 2010 [15]. Massachusetts educators played a significant role in the writing of the initial Common Core standards [16]. When the standards were implemented in Massachusetts, they were adapted within federal guidelines to meet the specific needs of Massachusetts students [16]. Traditionally one of the highest performing states in the country, Massachusetts has saw its test scores decline after it implemented the Common Core curriculum in 2010 [15].
- In 2017, the Massachusetts Board of Elementary and Secondary Education voted to adopt new standards (separate from MassCore) crafted exclusively by Massachusetts educators and designed to maintain the Commonwealth’s position as a leading state in education [17]. State officials like Governor Charlie Baker and Elementary and Secondary Education Commissioner Mitchell Chester emphasized that these standards were specific to Massachusetts and not an adaptation of any national standards like the Common Core [17]. Enhancements in this set of standards from the Common Core include increased literacy instruction in disciplines traditionally thought of as beyond the reach of the humanities (such as mathematics and science) and clarified guidance for placing students in higher level and AP math courses [17].
- Massachusetts piloted the PARCC test (designed to measure mastery of the Common Core curriculum) in 2014 and 2015 but eventually decided to administer its own test, the “Next Generation MCAS,” in 2017. This test now measures mastery the Massachusetts-specific standards which were implemented after the repeal of Common Core [18].
- Adoption of Next Generation Science Standards (NGSS):
- Massachusetts has standards that are adapted from, but not identical to, the NGSS. Massachusetts’ standards focus on the disciplinary core ideas and practices of the NGSS and are more specific, which allows for more consistent interpretation than with the NGSS. These state standards also treat technology and engineering as a discipline separate from the sciences, and, in this vein, contain a greater focus on readiness for college and careers than the national standards. Massachusetts did a science standards review starting in 2009 and continuing for several years afterwards. The review culminated in the release of an updated set of standards in 2014 [19].
- Number of charter schools and percentage of students served (if applicable):
- Currently, there are 78 charter schools in Massachusetts, and these schools serve 4.54 percent of all students in the state [20, 5].
- Charter schools have existed in Massachusetts since 1993; they were established with the passage of the Massachusetts Education Reform Act (MERA) of 1993 [21].
- Voucher dollar amounts and percentage of students served (if applicable):
- Massachusetts provides no financial assistance (either in the form of vouchers or tax credits) to parents who wish to send their children to private schools instead of public schools [22].
- Permissible voucher use (i.e., religious schools):
- The state of Massachusetts does not provide vouchers to parents, so voucher use is not permissible for any independent schools, religious or secular [22].
- Average teacher salary:
- The average teacher salary in the state of Massachusetts was $84,599 in 2020 [23]. This figure is far higher than the average national teacher salary in 2020, which was $63,645 [24].
- Presence of teachers unions/collective bargaining (e.g., AFT/NEA):
- The Massachusetts Teacher Association (MTA), a local affiliate of the National Educators’ Association (NEA), is the main teachers’ union in Massachusetts. MTA has localized branches in school districts throughout the state. Massachusetts also has a branch of the American Federation of Teachers (AFT) [25].
- The work of these organizations and the strong collective bargaining rights possessed by Massachusetts teachers are evidenced by the high salaries of teachers in the state, which are far above the national average and are indeed among the best in the country. Several districts have average salaries that exceed $100,000 [26].
- These findings are unsurprising as Massachusetts is a heavily Democratic, union-supporting state, and private school vouchers are not permitted in Massachusetts, keeping public schools strong [27, 22].
- Merit pay for teachers (in state or district):
- Although Newton, Massachusetts was home to the first merit-based pay system in the United States, the practice did not become popular in the state [28].
- However, in 2005, Governor Mitt Romney proposed a system of merit-based pay for teachers which included bonus payments for teaching AP courses in STEM fields, enrolling in certain teacher-training courses, and receiving strong evaluations from administrators [29].
- This plan was heavily criticized by the Massachusetts Teachers Association (MTA), which claimed the plan advantaged teachers in suburban schools with more resources. MTA also argued that the plan would encourage the best teachers from schools with less resources to go to suburban schools, where they would be more likely to teach advanced courses and be able to enroll the courses necessary to receive merit-based pay [29].
- There is currently no statewide merit-based teacher pay in Massachusetts, though it is allowed at the district level, and some districts do indeed have merit-based pay system [28].
- Teacher evaluation methods and measures:
- Teachers in Massachusetts are primarily evaluated through the Massachusetts Educator Evaluation Framework, which aims to advance student learning by giving educators feedback on their teaching and providing them with clear expectations as well as professional development opportunities [30].
- This framework includes:
- standards of effective practice (Curriculum, Planning, and Assessment, Teaching All Students, Family and Community Engagement, and Professional Culture),
- rubrics for assessment and self-assessment,
- three categories of evidence to base these assessments on (multiple measures of student learning, growth, and achievement, judgments based on observations and artifacts of professional practice, and additional evidence relevant to one or more performance standards),
- performance ratings,
- educator plans, and
- the five-step evaluation cycle (see below) [31].
- Evaluation occurs through a five-step cycle involving (1) formative assessment/evaluation; (2) summative evaluation; (3) self-assessment; (4) analysis, goal setting, and plan development; and (5) implementation of the plan [31].
- Teachers are assessed using six focus indicators: (1) curriculum and planning, (2) learning environment, (3) cultural proficiency, (4) family collaboration, (5) reflection, and (6) professional collaboration [31].
- Administrators are also assessed using a similar set of six key factors: (1) curriculum, (2) instruction, (3) environment, (4) human resources management and development, (5) family and community engagement, and (6) cultural proficiency [31].
Data Analysis:
- Based on the data you’ve collected, why do inequities persist in your state? What evidence did you see of the state addressing or overcoming inequities?
Inequalities in Massachusetts public schools exist for a variety of factors including funding structures, disparate graduation rates, and school segregation, all of which perpetuate inequality.
Funding structures are one of many causes for inequality in Massachusetts’ public education system. Because the vast majority of funding for schools comes from property taxes, school districts spend wildly different amounts in per pupil funding––the highest a district spends per student in Massachusetts is Provincetown, which spends over $45,000 each year per pupil, while Dracut spends less than one-third of that at below $12,000 per student every year [4]. These massive differences create vastly unequal learning environments for students in different areas of the state.
Also, graduation rates in Massachusetts are highly stratified along racial lines. While graduation rates for Asian and white students are 96.1 percent and 93.2 percent, respectively, those for African-American and Hispanic or Latino students are significantly lower at 84.4 percent and 80 percent, respectively [8]. Graduation rates that differ greatly based on a student’s race result in students from racial categories with lower graduation rates being less able to obtain high-paying jobs, which in turn, results in these students’ children having fewer opportunities to attend well-funded schools and improve their families’ fortunes.
These two issues converge in an especially pernicious way due to widespread school segregation in Massachusetts. An article from The Boston Globe explains that 10.4 percent of Massachusetts’ schools were “intensely segregated”––meaning that students of color comprise more than 90 percent of the school’s population––in 2019-2020, an increase from 7.8 percent in 2009-2010. Many “intensely segregated” schools where students of color make up the vast majority of the student population are outdated and often lack the technological capabilities necessary to deliver a modern-day education. Conversely, many schools that enroll primarily white students have recently been built or renovated and are home to state-of-the-art technology [32].
These inequities stem in part from the Boston Busing Riots of the 1970s. After the Boston Public Schools were forced to enact a desegregation program in 1974, many white families withdrew their children from the public schools, instead enrolling them in private schools or moving to the suburbs, where desegregation efforts were not as prominent [33]. The sharp decline in the white population of Boston Public Schools has increased inequality in education in addition to preserving the racial isolation that was present prior to desegregation efforts.
However, Massachusetts has been working to overcome these inequities and provide equal opportunities for success to all students. One program designed to achieve this goal, the Metropolitan Council for Educational Opportunity (METCO), has operated for over half a century. The METCO program buses students of color from the Boston Public Schools to wealthy, majority-white suburban districts. Students that enroll in the METCO program have been found to graduate from high school and attend college at far higher rates than similar students in the Boston Public Schools [32].
More recently, cultural competency was added to the Massachusetts Educator Evaluation Framework, reflecting the recognition of education officials in Massachusetts that such skills are necessary to cultivate equitable and genuinely inclusive classrooms for students of all backgrounds. This step is especially critical because it will ensure that teachers are equipped with the necessary tools to help all students feel part of classroom communities in schools that may be located in areas very different from their homes [30].
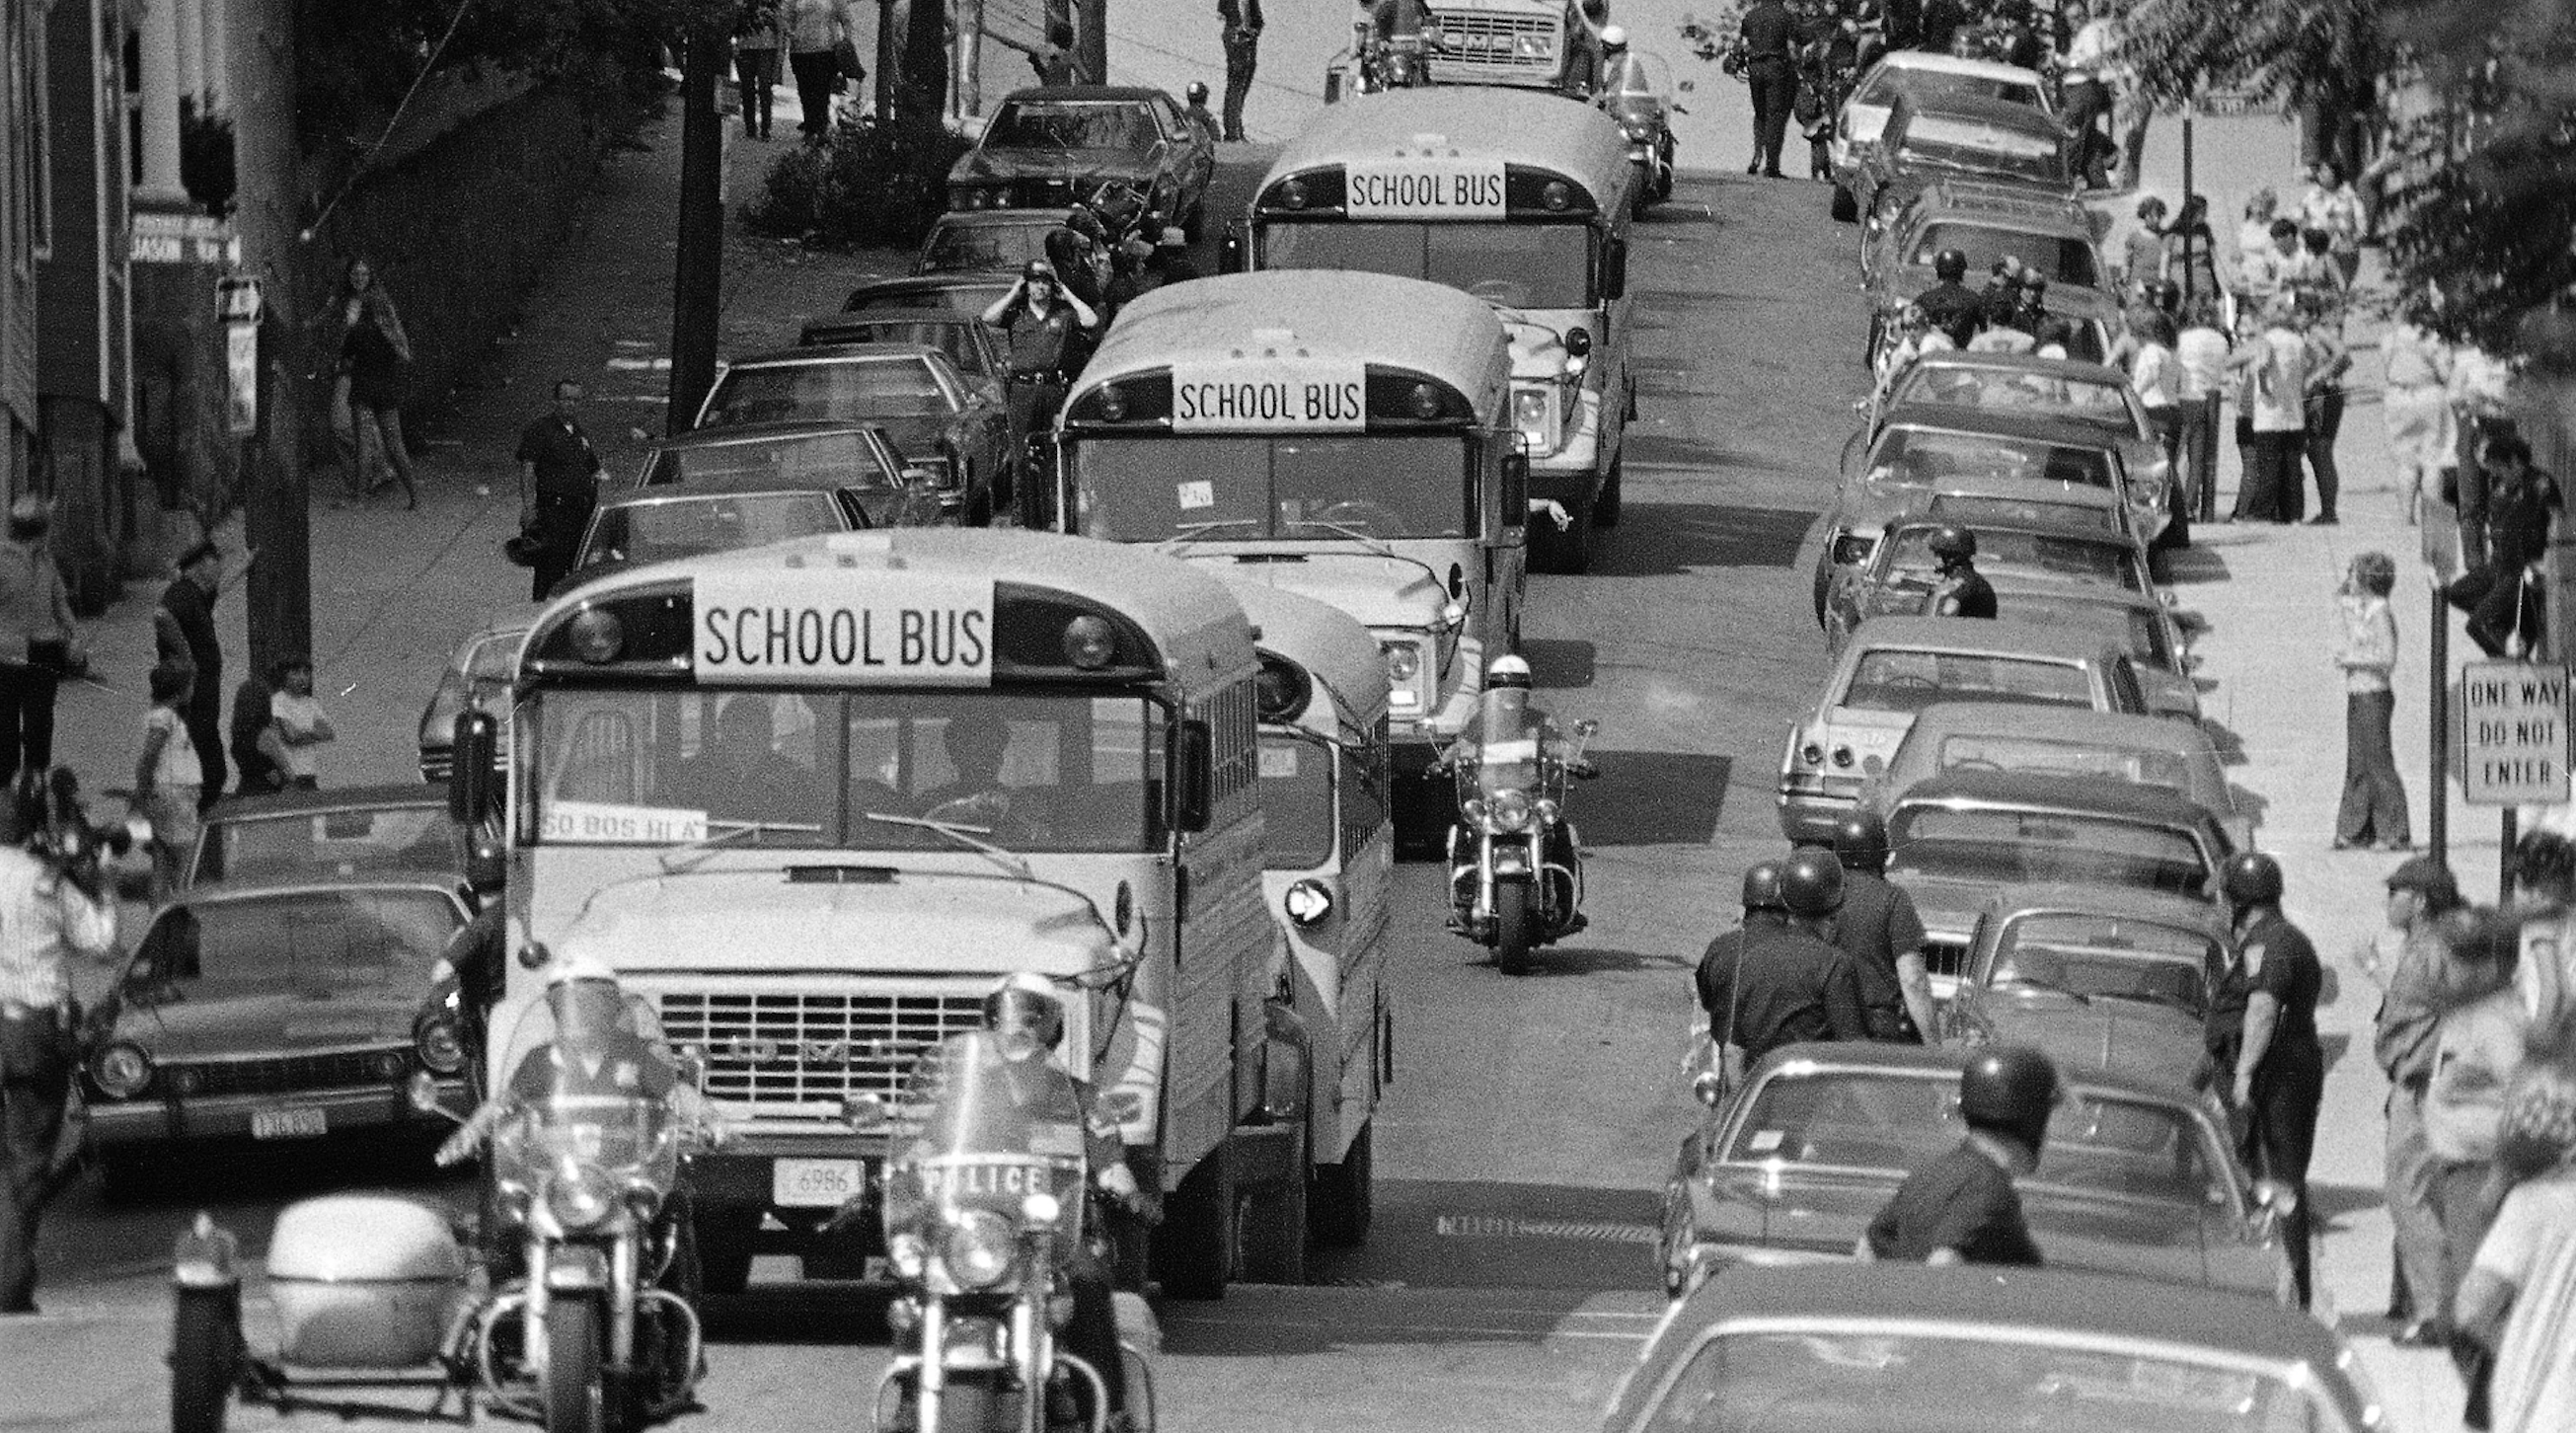
Image: Police on motorcycles escort a school bus through Boston at the high of the Boston Busing Riots, September 1976 [38].
- Describe and analyze one particular trend or education-specific event in your state. Make sure to contextualize this trend or event within the big picture you’ve created from your data analysis.
An educational trend in Massachusetts over the last decade has been the constantly shifting landscape of educational standards, standardized tests, and teacher evaluation methods. While these shifts have occurred throughout the country, they have been intertwined with the Commonwealth’s historical place as one of the best states in the country for education and its desire to remain there.
Along with many other states, Massachusetts adopted the Common Core curriculum in 2010 to be eligible for grants under President Obama’s “Race to the Top” program [15]. In accordance with this decision, the state piloted the PARCC (Partnership for Assessment of Readiness for College and Careers) exam in 2014 and 2015 [18]. Although Massachusetts educators were some of the leading writers of these standards, the state replaced Common Core with its own set of standards in 2017 [17]. In the same year, Massachusetts administered the “NextGeneration MCAS,” its own standardized assessment, instead of fully implementing the PARCC test [18].
Today, Massachusetts is again becoming a leader in the discussion around standardized tests, as students, teachers, and government officials are fighting back against MCAS. They argue that it is excessively burdensome on young children, does not accurately measure student learning, and the ways its results are used excessively harm students of color. Some, such as State Sen. Jo Comerford (D-Northampton) and State Rep. Jim Hawkins (D-Attleboro), are proposing reforms to make tests more reflective of what students learn in school. The new tests would involve group projects and process-based assessment, which more closely resemble what student students experience in the workplace. Various constituencies throughout the state have chosen to rethink the standardized test, a cornerstone of the educational experience of students for decades, an initiative that demonstrates why Massachusetts is a leader in education [34].
Another example of Massachusetts being a leader in the field of education is how it has tailored the Next Generation Science Standards (NGSS) to its needs. Instead of adopting the standards exactly as they were written, Massachusetts educators evaluated the standards and compared them to what was then in place to create a set of standards that worked best for the Commonwealth and its students. Specifically, Massachusetts included more specificity in the language of the standards to aid teachers and placed greater focus on preparing students for college STEM courses and possible STEM careers, both of which help the Commonwealth’s students and teachers reach new heights in scientific disciplines [19].
Massachusetts has also shown its leadership in the field of education through changes to its teacher evaluation framework. In a time when teacher evaluation standards are ever-changing, the Commonwealth has worked to include critical skills for 21st century teachers, such as cultural proficiency and familial relations into the Massachusetts Educator Evaluation Framework [30]. These two skills are especially critical as efforts to advance diversity, equity, and inclusion take prominence and the importance of teachers’ relationships with their students’ families increases after over a year of remote learning for many students.
Massachusetts’ work to establish the best standards and the best assessments for students illustrates how it has been, and will continue to be, a leader in the rapidly evolving world of education.
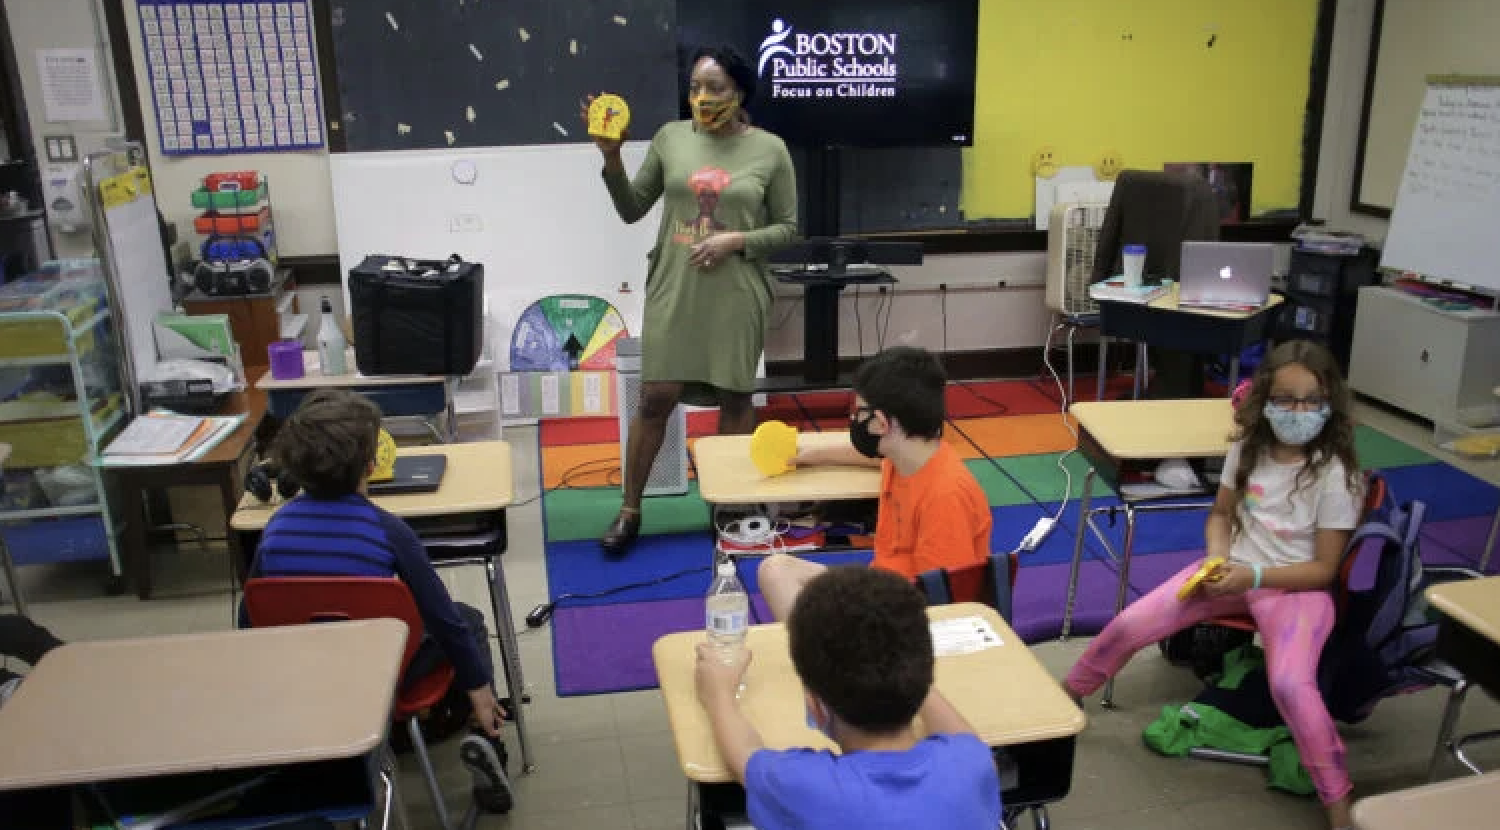
Image: Second-grade students and their teacher, Rachelle Milord, at Mozart Elementary School in Boston, June 2021 [39].
WORKS CITED:
- “Massachusetts School and District Profiles.” Enrollment Data (2021-22) – Massachusetts. Accessed May 7, 2022. https://profiles.doe.mass.edu/profiles/student.aspx?orgcode=00000000&orgtypecode=0&.
- “Massachusetts School and District Profiles.” Massachusetts Department of Elementary and Secondary Education. Accessed May 7, 2022. https://profiles.doe.mass.edu/profiles/finance.aspx?orgcode=00000000&orgtypecode=0&.
- Hanson, Melanie. “U.S. Public Education Spending Statistics [2022]: Per Pupil + Total.” Education Data Initiative, March 21, 2022. https://educationdata.org/public-education-spending-statistics#:~:text=Schools%20in%20the%20United%20States,operation%20and%20Development%20(OECD).
- “Per Pupil Expenditures, All Funds.” Massachusetts Department Of Elementary And Secondary Education – Per Pupil Expenditures Statewide Report. Accessed May 7, 2022. https://profiles.doe.mass.edu/statereport/ppx.aspx.
- “2020-21 School Attending Children Statewide Report.” Massachusetts Department of Elementary and Secondary Education, May 27, 2021. https://profiles.doe.mass.edu/statereport/schoolattendingchildren.aspx.
- “Enrollment Data (2021-22) – Massachusetts.” Massachusetts Department of Elementary and Secondary Education. Accessed May 7, 2022. https://profiles.doe.mass.edu/profiles/student.aspx?orgcode=00000000&orgtypecode=0&.
- “Selected Populations (2021-22).” Massachusetts Department of Elementary and Secondary Education. Accessed May 7, 2022. https://profiles.doe.mass.edu/profiles/student.aspx?orgcode=00000000&orgtypecode=0&leftNavId=305&.
- “Cohort 2021 Graduation Rates.” Massachusetts Department of Elementary and Secondary Education, 2021. https://profiles.doe.mass.edu/grad/grad_report.aspx?orgcode=00000000&orgtypecode=0&.
- Massachusetts Department of Elementary and Secondary Education. “Graduation Requirements – Massachusetts Comprehensive Assessment System.” Massachusetts Department of Elementary and Secondary Education. Accessed May 7, 2022. https://www.doe.mass.edu/mcas/graduation.html#:~:text=The%20MassCore%20program%20includes%20four,health%2C%20and%2For%20technology.
- MassachusettsESE. “MCAS Student Growth Percentiles – The Basics of the Growth Model.” YouTube. YouTube, December 29, 2014. https://www.youtube.com/watch?v=umufzva0N4I.
- “Prep for Massachusetts State Testing with MCAS Practice Tests.” Edulastic, March 25, 2022. https://edulastic.com/assessments/mcas-practice-test/.
- Massachusetts Department of Elementary and Secondary Education. “Sustainable Improvement in Massachusetts: How It Works.” Massachusetts Department of Elementary and Secondary Education. Accessed May 7, 2022. https://www.doe.mass.edu/turnaround/howitworks/.
- Massachusetts Department of Elementary and Secondary Education. “MA Graduation Requirements and Related Guidance.” Graduation Requirements – Massachusetts Comprehensive Assessment System. Accessed May 7, 2022. https://www.doe.mass.edu/mcas/graduation.html#:~:text=The%20MassCore%20program%20includes%20four,health%2C%20and%2For%20technology.
- Massachusetts Department of Elementary and Secondary Education. “Accountability and Assistance System Overview.” Massachusetts Department of Elementary and Secondary Education. Accessed May 7, 2022. https://www.doe.mass.edu/accountability/.
- Gass, Jamie, and Jim Stergios. “Massachusetts K-12 Standards: Worse in English & Mediocre in Math.” Pioneer Institute. Editorial Staff https://pioneerinstitute.org/wp-content/uploads/logo_440x96.png, December 11, 2020. https://pioneerinstitute.org/featured/study-updated-massachusetts-k-12-standards-worse-english-still-mediocre-math/.
- “Adoption of the New Massachusetts Curriculum Framework for English Language Arts and Literacy, Incorporating the Common Core State Standards, and the New Massachusetts Curriculum Framework for Mathematics, Incorporating the Common Core State Standards – Massachusetts Board of Elementary and Secondary Education.” The Massachusetts Board of Elementary and Secondary Education. Accessed May 7, 2022. https://www.doe.mass.edu/bese/docs/fy2011/2010-12/item1.html#:~:text=On%20July%2021%2C%202010%2C%20the,their%202004%20Supplements%2C%20contingent%20upon.
- Massachusetts Department of Elementary and Secondary Education. “Massachusetts Adopts Revised English Language Arts and Math Standards.” Massachusetts Department of Elementary and Secondary Education. Accessed May 7, 2022. https://www.doe.mass.edu/news/news.aspx?id=24278.
- Chappell, Bill. “Massachusetts Drops Federal Common Core Test, Aiming at Its Own.” NPR. NPR, November 17, 2015. https://www.npr.org/sections/thetwo-way/2015/11/17/456404304/massachusetts-opts-out-of-federal-common-core-test-aiming-at-its-own.
- Massachusetts Department of Elementary and Secondary Education. “Massachusetts’ Adaptation of Next Generation Science Standards.” Massachusetts Department of Elementary and Secondary Education, January 9, 2014. https://www.doe.mass.edu/stem/standards/ngss-maacomparison.html.
- “Charter Schools in Massachusetts.” Ballotpedia. Accessed May 7, 2022. https://ballotpedia.org/Charter_schools_in_Massachusetts#:~:text=These%20schools%20enrolled%20approximately%2040%2C300,enrollment%20in%20 Massachusetts%20in%202015.
- Candal, Cara Stillings, and Ken Ardon. “Charter Public School Funding in Massachusetts: A Primer. Policy Brief.” Pioneer Institute for Public Policy Research. Pioneer Institute for Public Policy Research. 185 Devonshire Street, Boston, MA 02110. Tel: 617-723-2277; Web site: http://www.pioneerinstitute.org, January 31, 2019. https://eric.ed.gov/?id=ED593774.
- “School Choice in Massachusetts.” Ballotpedia. Accessed May 7, 2022. https://ballotpedia.org/School_choice_in_Massachusetts#:~:text=Financial%20assistance-,According%20to%20the%20Friedman%20Foundation%20for%20Educational%20Choice%2C%20as%20of,schools%20instead%20of%20public%20schools.
- “Massachusetts School and District Profiles.” Teacher Salaries (2018-19) – Massachusetts. Accessed May 7, 2022. https://profiles.doe.mass.edu/profiles/teacher.aspx?orgcode=00000000&orgtypecode=0&leftNavId=815&.
- Wheelwright, Trevor. “Best States for Teacher Pay in 2021.” Business.org, April 21, 2022. https://www.business.org/hr/workforce-management/best-us-states-for-teachers/.
- “Stateweb.” AFT Massachusetts. Accessed May 7, 2022. http://ma.aft.org/.
- “Teacher Salaries Report.” Massachusetts Department Of Elementary And Secondary Education – Teacher Salaries Statewide Report. Accessed May 7, 2022. https://profiles.doe.mass.edu/statereport/teachersalaries.aspx.
- Chieppo, Charles. “Unions Are the 1-Percenters in Massachusetts – The Boston Globe.” BostonGlobe.com. The Boston Globe, December 9, 2012. https://www.bostonglobe.com/opinion/2012/12/09/unions-are-percenters-massachusetts/uxdtlpjLN0vi8gmaxgQkOL/story.html.
- “Teacher Merit Pay.” Ballotpedia. Accessed May 7, 2022. https://ballotpedia.org/Teacher_merit_pay.
- “Massachusetts Governor Proposes Merit Pay System for Teachers.” The Heartland Institute. December 1, 2005. Accessed May 7, 2022. https://www.heartland.org/news-opinion/news/massachusetts-governor-proposes-merit-pay-system-for-teachers?source=policybot.
- Massachusetts Department of Elementary and Secondary Education. “The Massachusetts Educator Evaluation Framework.” Educator Evaluation – Educator Effectiveness. Accessed May 7, 2022. https://www.doe.mass.edu/edeval/.
- Massachusetts Department of Elementary and Secondary Education. “Resources for Educator Evaluation Implementation in 2021-22 – Educator Evaluation.” Massachusetts Department of Elementary and Secondary Education. Accessed May 7, 2022. https://www.doe.mass.edu/edeval/implementation/default.html.
- Scharfenberg, David. “Massachusetts’ Public Schools Are Highly Segregated. It’s Time We Treated That like the Crisis It Is.” BostonGlobe.com. The Boston Globe, March 23, 2022. https://www.bostonglobe.com/2020/12/11/opinion/massachusetts-public-schools-are-highly-segregated-its-time-we-treated-that-like-crisis-it-is/.
- “Busing, Segregation, and Education Reform in Boston.” Poverty USA. Accessed May 7, 2022. https://povertyusa.org/stories/busing-segregation-and-education-reform-boston.
- Sokolow, Amy. “Mass. Teachers Union: MCAS Test ‘Has Allowed White Supremacy to Flourish in Public Schools’.” Boston Herald. Boston Herald, September 18, 2021. https://www.bostonherald.com/2021/09/18/mass-teachers-union-mcas-test-has-allowed-white-supremacy-to-flourish-in-public-schools/.
- “Flag of Massachusetts.” Encyclopædia Britannica. Encyclopædia Britannica, inc. Accessed May 7, 2022. https://www.britannica.com/topic/flag-of-Massachusetts.
- “Newton North High School New Facility – Acentech Project Profile.” Acentech, February 19, 2022. https://www.acentech.com/project/newton-north-high-school/.
- Christensen, Dusty. “Holyoke Council Votes to Bond $475K for Middle School Feasibility Study.” Daily Hampshire Gazette. Concord Monitor, February 16, 2022. https://www.gazettenet.com/Holyoke-City-Council-votes-to-bond-for-middle-school-feasibility-study-45129640.
- Delmont, Matthew. “The Lasting Legacy of the Busing Crisis.” The Atlantic. Atlantic Media Company, June 28, 2019. https://www.theatlantic.com/politics/archive/2016/03/the-boston-busing-crisis-was-never-intended-to-work/474264/.
- Turner, Lane. “What to Know about Boston Schools’ Covid Safety Reopening Plan.” Boston.com. The Boston Globe, August 26, 2021. https://www.boston.com/news/schools/2021/08/26/what-to-know-about-boston-schools-covid-safety-reopening-plan/.