Are Minnesota Public Schools Good…For Everyone?
By Morgan Richter

Minnesota public schools serve over 870,000 students annually (MN Department of Education, 2022) but what quality of education are these students receiving? According to 2019-2020 school year national public school system rankings, Minnesota has the seventh best public school system in the United States (Forbes Magazine, 2020). However, that same year, Minnesota ranked 49th out of 50 states in education equality when measuring the achievement gap between white and minority students (Wallethub, 2020). Furthermore, in 2019, the US Department of Education ranked Minnesota last out of all 50 states in racial disparities in graduation rates (Sohoni, 2021).
This discrepancy between public school education quality and equality is not unique to Minnesota–half of states ranked in the top 10 in education quality were ranked in the bottom 10 in education equality (Forbes Magazine and Wallethub, 2020). But why is Minnesota, which has shown the ability to teach effectively based on rankings, not able to do so for all students? Let’s investigate…
Basic Education Statistics
Note: all statistics refer to MN unless otherwise noted.
- Total public school student population: 870,506 students (MN Department of Education, 2022)
- Average per pupil expenditure: $13,603 (Education Data Initiative, 2022)
- High/low per pupil expenditure: $34,789/$9,105 (Wallet Hub, 2021)
- Average national per-pupil expenditure: $14,418 (Education Data Initiative, 2022)
- Average teacher salary: $58,221 (World Population Review, 2022)
- Teacher Unions and Collective Bargaining: American Federation of Teachers (AFT) and National Education Association (NEA) and AFL-CIO are all present in MN and collective bargaining is permitted (Education Minnesota, 2022).
Minnesota Public School Student Demographics
Minnesota is a fairly white state when it comes to public school student demographics. The majority of public school students (over 60%) are white, with most minorities each comprising 6-12% of the remainder of the student body (MN Department of Education, 2022).
Table 1. Minnesota Public School Student Demographics
|
Demographic |
Number of Students | Percentage of Students |
| Hispanic | 91,601 |
10.5 |
|
American Indian/Alaska Native |
14,901 | 1.7 |
| Asian | 60,461 |
6.9 |
|
Black |
101,388 | 11.6 |
| White | 549,237 |
63.1 |
|
2+ Races |
52,028 | 6.0 |
| English Learner | 77,473 |
8.9 |
|
Special Ed |
147,063 | 16.9 |
| Free/Reduced Lunch | 274,886 |
31.6 |
|
State |
870,506 |
100 |
(MN Department of Public Education, 2022)
Table 1 shows that even though Minnesota has a majority white student body, nearly 40% of the student body still consists of minority students (MN Department of Public Education, 2022). How are these students fairing relative to their white counterparts on different indicators of academic success such as test scores and graduation rates?
Test Scores
In Minnesota, there are two primary tests used to assess student learning in the spring of the academic school year:
Minnesota Comprehensive Assessment (MCA): test the majority of Minnesota students take.
Minnesota Test for Academic Skills (MTAS): For special education students with severe cognitive disabilities.
These tests measure different subject achievement in different grades…
- In grades 3-8, students take the math and reading MCAs.
- In grade 10, students take the reading MCA again.
- In grade 11, students take the math MCA again.
- In grades 5, 8, and 11, students take the science MCA.
While state test scores cannot prevent students from graduating, scores do impact federal funding and, most importantly, provide evidence of performance discrepancies between students of different demographic backgrounds (MN Department of Public Education, 2022).
Table 2. Minnesota Public School Student MCA Test Scores by Demographic
| Demographics | Grade 4 Reading Proficiency (%) |
Grade 8 Math Proficiency (%) |
|
White |
65 |
65 |
|
American Indian/Alaska Native |
31 |
25 |
|
Asian |
48 | 63 |
|
Black |
31 |
29 |
|
Hispanic |
32 |
35 |
| Free/Reduced Lunch | 36 |
36 |
| All | 56 |
57 |
(MN Department of Public Education, 2022)
Table 2 shows that white students score approximately two times as high on both reading and math MCA tests than black, hispanic, and American Indian/Alaskan Native students.
Figure 1. Minnesota Grade 4 MCA Test Scores Over Time by Race. a) Grade 4 Reading Score, b) Grade 8 Math Score

Figure 1 shows that white students have consistently scored significantly higher than hispanic, African American, and American Indian students on both the MCA reading and math tests.
Figure 2. Minnesota MCA Test Scores by School Demographics a) Grade 4 Reading Score, b) Grade 8 Math Score
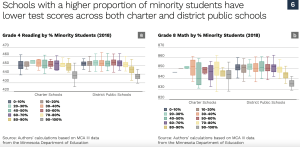
(Figures 1 & 2, Federal Reserve Bank of Minneapolis, 2019)
Figure 2 shows that schools with a greater percentage of minority students scores lower on both the MCA reading and math tests.
Graduation Rates
Even though test scores cannot prevent students from graduating, the correlation between student demographics and test scores persists in graduation rates as well. White and asian students graduate at significantly higher rates than other minorities (MN Department of Public Education, 2020).
Table 3. Minnesota Public School Graduation Rates by Demographics
|
Demographic |
Graduation Rate (%) |
| Hispanic |
70.4 |
|
American Indian/Alaska Native |
55.7 |
| Asian |
89.1 |
|
Black |
69.2 |
| White |
89.0 |
|
2+ Races |
73.5 |
| English Learner |
66.2 |
|
Special Ed |
65.0 |
| Free/Reduced Lunch |
71.6 |
|
State |
83.8 |
(MN Department of Public Education, 2020)
Table 3 shows that white and asian students graduate at rates 19-33% greater than black, hispanic, and American Indian/Alaska Native students.
School Segregation
The double edged sword of school choice
According to Myron Orfield, a professor at the University of Minnesota Law School who kept records of resegregation in Minneapolis and St. Paul neighborhoods and schools, Minnesota use to be an “integration success story” (NBC News, 2020). This was largely a result of state and regional, not national policy including…
- Required affordable housing to be provided by municipalities, preventing low-income and mostly-minority families from being excluded from communities.
- Rules preventing districts from having too many students of one race in one school, punishable by loss of state funding.
- Busing of minority students to predominantly white schools (NBC News, 2020).
The result was successful integration. In the 1993-1994 school year, less than 1% of black students in Minneapolis went to schools with significant segregation, with segregation being defined as a student body consisting of 90% of more white students (NBC News, 2020).
However, current school demographics tell a different and disappointing story. In the 2017-2018 school year, 25% of black students attended highly segregated schools (NBC News, 2020). But what is the cause of increased segregation in a state that seems to have been making efforts to integrate schools?
Charter Schools-Sahan Journal article analysis of St. Paul parents choosing charter schools that overwhelmingly match their children’s demographic backgrounds
Charter schools are public schools that are not a child’s designated local public school, but offer another option for public school students besides their local district school. Charter schools can be operated either by public school districts, or by private entities. Minnesota was the pioneer of charter schools in the United States with the opening of the first charter school in 1992.
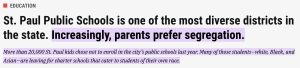
However, a news article by the Sahan Journal provides an incredibly interesting insight into how easy it is for school segregation to occur when people of all demographic backgrounds are given the opportunity to choose for themselves where their children go to school. Unlike local public schools, charter schools in Minnesota do not need to follow state integration policy passed in 1999, which requires districts where minority attendance is 20% points greater than bordering districts to create integration plans. This has resulted in not only a significant portion of inner-city students choosing charter schools instead of their diverse local public school, but choosing charter schools that consist predominantly of students of their own racial background. An excellent example of this is in St. Paul, where during the 2020-2021 school year, 20,000 students (37%) opted out of their local public schools, 60% of which chose charter schools. Even more striking is that across all races, most of students enrolled in charter schools attended charter schools that were highly segregated, with the majority race being the same as their own race (Sahan Journal, 2022).
Figure 3. St. Paul Public School Demographics
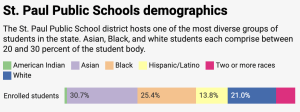
Figure 3 shows that local St. Paul public schools are incredibly diverse.
Figure 4. St. Paul Student School Enrollment

Figure 4 shows that most St. Paul students that do not enroll in their local public school choose to attend charter schools.
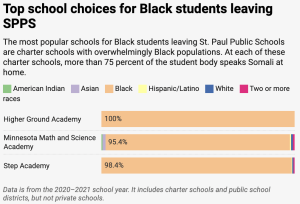
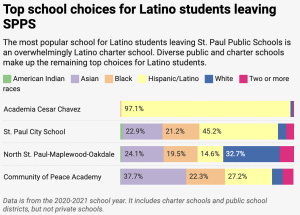
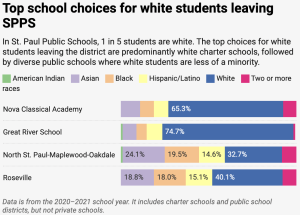
Figure 5. St. Paul Student Top Charter School Choices by Race
a) Asian students

b) Black students
c) Latino students
d) White students
(Figures 3, 4, & 5, Sahan Journal, 2022)
Figure 5 shows that most St. Paul students that enroll in charter schools choose to attend charter schools where a vast majority (65-99%) of the student body shares the same demographic background as them.
Open Enrollment
Another contributing factor to segregation in Minnesota public schools in open enrollment. In Minnesota, families can opt to have their children attend public school districts outside of their own, a term called open-enrollment. This has resulted in a disproportionate number of white children from predominantly-minority schools, many of which are inner-city schools, leaving their more diverse local public schools, contributing to the highly segregated school structure observed today in Minnesota (MPR News, 2013).
- The Minneapolis, St. Paul, and St. Cloud school districts, which are some of the largest school districts in the state, lose a large numbers of students to open enrollment, the majority of which are white.
- Suburban school districts that lose the most students to open enrollment are inner-ring suburb districts with large minority populations.
- Mostly-white school districts gain the most students from open-enrollment (MPR News, 2013).
Funding
The average spending per student in Minnesota is $13,603 (Education Data Initiative, 2022). But how does average pupil spending break down by demographic traits such as poverty, ethnic background, and race?
According to Nicola Alexander, an associate professor of school funding and equity for the College of Education and Human Development at the University of Minnesota, Minnesota does a good job of providing more funding to school districts with a greater proportion of students eligible for free and reduced lunch. However, this does not necessarily mean that this relative increased funding carries over to racial disparities (MPR News, 2019).
- Public school districts that consist of primarily non-white students receive 8% less funding than school districts with a mostly white student body.
- Specifically among poorer school districts, poorer school districts consisting of mostly white students receive $509 more dollars per student in funding than mostly non-white and poor public school districts (MPR News, 2019).
Clearly Minnesota is making an effort to close achievement gaps by providing more funding to students eligible for free and reduced lunches. Why is this not carrying over to racial and ethnic demographic inequities?
- Poorer students of non-white backgrounds are more likely to be concentrated in metropolitan areas such as Minneapolis and St. Paul, whereas rural school districts often have a greater proportion of white students on free and reduced lunch.
- Rural school districts often receive more funding relative to suburban and metropolitan school districts to take into account for a more spread out student body and therefore greater transportation costs.
- However, funding does not take into account the greater cost of living and therefore more money that must be spent on teacher salaries (up to 18% difference) in metropolitan areas than in rural school districts, which often contain more non-white and white students, respectively (MPR News, 2019).
Public School Teacher Demographics
Minnesota is known to have inequalities in academic outcomes for students based on demographic background, but it is less known that this discrepancy persists to teachers as well. While roughly 34% of Minnesota public schools students are black, Native American, and/or students of color, a measly 5% of Minnesota public schools teachers are of the same demographic backgrounds (Velazco, 2021). While this may seem trivial, the representation of teachers of different backgrounds can play a significant role in student academic performance. For instance, according to a 2017 study by John Hopkins and American University researchers, “a single black teacher reduced the prospect of a black student dropping out by 27%” and increased the prospect of enrolling in college by 13%. Furthermore, black students with “two black teachers were 32% more likely to go to college” (Anderson 2020).
Data Analysis and Concluding Thoughts
The biggest inequality in Minnesota’a public education system is racial inequality. Despite having the seventh best public school system in the United States (Forbes Magazine, 2020), Minnesota ranks second to last in education equality between students of different races (Wallethub, 2020) and last in educational equality based on graduation rates (Sohoni, 2021). This is evident in test scores and graduation rates. White students in Minnesota public schools score two fold higher on MCA reading and math tests (65 and 65, respectively) than their black (31 and 29), latino (32 and 35), and Native American (31 and 25) counterparts. In addition, white and asian students in Minnesota public schools graduate at rates (89.0% and 89.1%, respectively) that are significantly higher than their black, latino, and native counterparts (69.2%, 70.4%, and 55.7%, respectively) (MN Department of Public Education, 2022).
These discrepancies in education equality in Minnesota likely persist due to the wider trend of school segregation in the state that stems not from state mandates (which in the past have traditionally supported desegregation), but from the school choice mechanisms of charter schools and open enrollment that are permitted in Minnesota.
Charter schools allow public school students who come from families that may not be able to afford a private school to choose to attend a school different from their local school if the student’s family does not approve of the local school. While charter schools were an effort to give poorer and often minority children the opportunity to choose a school that best fits their needs without additional costs, what has occurred is children of all races leaving their local and often more diverse public schools to attend charter schools with student body demographics overwhelmingly matching their own. For instance, in St. Paul charter schools, the most popular charter schools for asian, black, and latino students typically have students bodies where 95% or greater of the student body is of the same demographic background as themselves (Figures 5 a, b, c, respectively). Though not as extreme for white charter-school attending students in St. Paul, the trend was the same, with the top charter schools of choice for white St. Paul students having students bodies where 65-75% of students are white (Figure 5d) (Sahan Journal, 2022).
The other main cause of segregation in Minnesota public schools is Minnesota’s open enrollment policy, which allows students to enroll in completely different school districts from their local district. This has resulted in an exodus of white students from inner-city schools that are often more diverse than suburban school districts, which are the most popular school districts for students to open-enroll into and are often highly white in student body demographics. Inner-city school districts such as Minneapolis and St. Paul, which have a greater proportion of minority students, experience the highest rates of students leaving to open-enroll in other districts. Inner-city suburbs with high proportions of minority students are also more likely to lose students to open-enrollment than their non-inner city suburb counterparts (MPR News, 2013). This increase of white students in suburban schools results in more minority students in city schools and inner-ring suburbs, both of which increase school segregation.
It is clear that there is segregation in Minnesota’s public schools, but how does this negatively impact the academic success of minority students relative to white students? The answer is differences in funding as a result of differences in school district locations and demographics. Due open enrollment resulting in white students leaving city school districts at high rates, inner-city schools have student bodies consisting of a disproportionate number of minority students relative to suburban and rural school districts. To account for increased transportation costs of a more spread out student body, rural schools receive more funding per student than city schools. While it is true that transportation costs are lower in urban environments, teachers that work in city schools must be payed more due to higher living costs (roughly 18% more) in urban relative to rural communities, meaning less money is left for student resources in city schools. Because urban school districts have less money to spend on students and because minority students attend city schools at disproportionate rates, this results in public school districts that consist primarily of non-white students receiving on average 8% less funding than school districts with mostly white student bodies, and could explain why minority students are not performing as well as white students-they simply do not have as many resources or financial support (MPR News, 2019).
There are clearly problems with Minnesota’s public schools that are resulting in racial inequities-is Minnesota doing anything to change this, though? According to the 2020 Minnesota Governor’s Education Roundable, Minnesota is attempting to close the racial inequality gap in public schools by…
- Passing legislation to increase the proportion of minority teachers in schools to better reflect the proportion of minority students in schools (Governor’s Education Roundtable, 2020).
- Only 5% of Minnesota teachers are people of color while roughly 34% of public school students are students of color (Velazco 2021).
- This will hopefully increase graduation rates and college enrollment of minority students, as one John Hopkins and American University study showed that black students with at least one Black teacher were 18% more likely to graduate and 13% more likely to go to college. The likelihood of enrolling in college increased to 32% when black students had two black teachers (Anderson, 2020).
- Note no specific legislation was specified, just the idea of passing such legislation.
- Use segregated schools as a result of “open enrollment” and “structural re-segregation” as an opportunity to tailor curriculum in schools where minorities make up most of the student body to have “culturally-specific” and “community-governed” schools (Governor’s Education Roundtable, 2020).
- This will hopefully make class more engaging and relevant to minority students, increasing academic performance.
- Increase resources to address “health care, employment, food, housing and other socioeconomic disparities” in the form of “full-service community schools,” since minority student are disproportionately poor relative to white students (Governor’s Education Roundtable, 2020).
Minnesota seems to have noticed and is making efforts to address the unacceptable and persistent inequalities in its public school system, which is an important part in fixing the problem. However, only time will tell if these changes will be effective at benefiting Minnesota’s public school students.
Bibliography