
Montana’s Elementary and Secondary Education System
by Hank Marriott
Attendance and Basic Expenses:
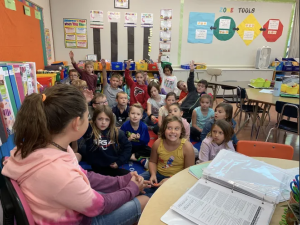
Image 1. Students at Meadowlark Elementary [1].
- Total public school student population: 146,252 students (Fall 2020) {2}
- Up 0.6% from the Fall of 2015
- Total state public education budget: $1.153 billion (2020) {3}
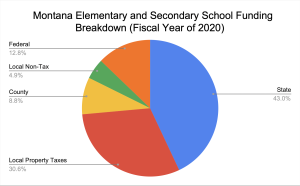
Figure 1. Created using data from [4]. State funding provides the most financial support to Montana’s Educational expenditures, followed by Local Property Taxes. Federal Funding only contributes 12.8%.
- Public vs. private school attendance (2020) {5}:
- Public school attendance: 144,636 students
- Private school attendance: 7,600 students
- Average per pupil expenditure: $11,984 (2018) {6}
- Average national per pupil expenditure: $13,187 (2018) {7}
- High/low per pupil expenditure within Montana (2021) {8}:
- High: Pleasant Valley Elementary School District ($99,000)
- Low: Kinsey Elementary School District ($8,098)
Student Demographics:
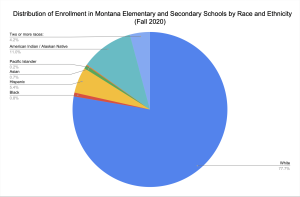
Figure 2. Created using data from [9]. White students demonstrate a clear majority of the student population at 77.7%, followed by American Indian/Alaskan Native students at 11.0%.

Figure 3. Created using data from [9]. Montana’s proportion of White students is exceptionally high compared to the national average (77.7% vs. 45.8%). The national average for the proportion of Black, Hispanic, and Asian students all significantly exceed those of Montana. However, Montana does have a much higher percentage of American Indian/Alaskan Native students in comparison to the national average (11.0% vs. 0.9%).
- Percent English Language Learners in public schools: 2.4% (2018) {10}
- United States: 10.2% (2018)
- Percentage of public school students living below the poverty line: 20.8% (2019) {11}
- National average: 20.1% (2019)
- Four Year Adjusted Cohort Secondary School Graduation Rates by Student Demographics (2019):

Table 1. Obtained from [12]. Although they represent a very small sample size proportionate to the graduating student population, Asian students possessed the highest graduation rate at 93.94%, followed by White students at 88.71%. Problematically, the lowest graduation rates were held by American Indian/Alaskan Native students, English Learners, and homeless children at 68.27%, 65.47%, and 62.67% respectively.
Accountability Measures:

Image 2. Montana classroom [13].
- Montana began its official switch to the Montana Common Core Standards in English Language Arts and Mathematics in July of 2013. These standards are used to inform the Montana Content Standards {14}.
- The Montana Content Standards provide benchmarks specific to each grade level that public school curricula are required to cover as part of Montana’s Balanced Assessment System {15}.
- Subjects covered:
- Arts
- Career and Technical Education
- Computer Science
- English Language Arts and Literacy
- Health Enhancement
- Library Media
- Mathematics
- Science
- Social Studies
- Technology Integration
- World Languages
- Subjects covered:
- While Montana hasn’t adopted the Next Generation Science Standards (NGSS) specifically, they’ve made their own science Content Standards based on the NGSS framework {16}.
- In order to adhere to the Every Student Succeeds Act (ESSA) requirements, Montana uses the Smarter Balanced assessment (one of 12 states to use this assessment) to test math and reading proficiency in public school students grades 3-8 according to its Content Standards. In addition to the Smarter Balanced assessment, Montana has its own Science Assessment to test students’ proficiency in the sciences for grades 5 and 8 according to the Content Standards. The ACT with writing is used to measure these same three proficiencies in 11th grade students. All districts are permitted to supplement these required exams with additional forms of testing to assess student performance. These exams are used by the state track the progress of students at public and private schools seeking accreditation {17, 18, 19, 20}.
- Montana also has an a Multi-State Alternate Assessment and an Alternate Montana Science Assessment used to measure the same proficiencies at the same age markers for students described to have “significant cognitive disabilities {17}.”
- Montana also requires that all students in grades 4-8 take the National Assessment of Educational Progress (NAEP). This exam is a congressionally mandated project conducted by the National Center for Education Statistics (NCES). The exam tests student proficiency in math and reading, and is required in order for states and school districts to receive Title I funding {21}.
- Results of most recent National Assessment of Educational Progress (NAEP) (for the 2020-21 school year):

Table 2. (Obtained from [22]). Shows Montana public school students scoring slightly above the national average for each subject and grade level of the NAEP, ranging from 2-5% better in proficiency each subcategory.
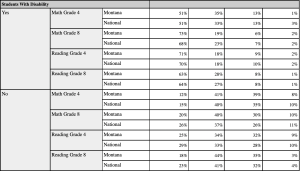
Table 3. Obtained from [22]. Shows Montana public school students with learning disabilities scoring right on par with the national average in terms of proficiency for each grade level and subject.
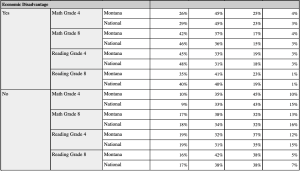
Table 4. Obtained from [22]. Shows Montana public school students with economic disadvantages scoring right on par with the national average in terms of proficiency for each grade level and subject.
Privatization of Montana Schools:
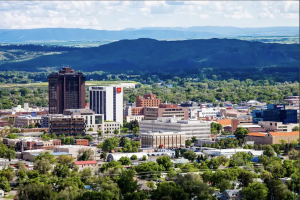
Image 3. Billings, the most populous county and largest school district in Montana [23].
- Montana is one of five states that has yet to adopt charter schools {24}.
- Montana’s private school voucher program exists, but it is very limited at this point in time. Roughly 40 students every year receive an average scholarship of $500, significantly less of a participating population and scholarship amount than other states with voucher programs {25}.
- The rules regarding the eligibility of schools for Montana’s voucher program have been under severe criticism for being far too lenient. The rules do not specify teacher credentials (college degrees, criminal background checks, etc.), as well as the school’s ability to report graduation rates, financial data, and other statistics. The State is also not required to publicize the data representing the demographics of the participating students of the voucher program {25}.
- The voucher program, which was initially created in 2015, was eventually struck down by the Montana Supreme Court for violating the Montana Constitution’s ban on financial aid for churches and religious schools. However, in June of 2020, the Supreme Court ruled in Espinoza v. Montana Department of Revenue that the Montana Supreme Court’s decision violated the freedom of religion. The impact of this case is monumental, considering that it effectively ruled state bans on financial aid to religious schools in as many as 38 states. In addition to this, 70% of all private schools in Montana are religiously affiliated, meaning that a large portion of the state’s private schools are now available to participate in the voucher program and potentially lead to its expansion {26, 27}.
Teacher Working Conditions:

Image 4. Bill Stockton, the 2022 Montana Teacher of the Year [28].
- Average teacher salary (in current US dollars): $52,894 (2020) {29}
- National average: $65,090 (2020)
- The Montana Federation of Public Employees (MFPE) has two national affiliates for teachers unions and collective bargaining: The American Federation of Teachers (AFT) which has 1.4 million national members, and the National Education Association with a 3.2 million member base. The MFPE elects delegates to represent Montana teachers at regional and national meetings of each union {30}.
- Montana does not implement merit pay for teachers proven to have a high level of teaching effectiveness {31}.
- Montana teachers are interestingly awarded tenure automatically after a three-year probationary period {32}.
- Montana does not explicitly make student performance or teacher ineffectiveness grounds for dismissal {32}.
Data Analysis:
While some of the data surrounding Montana’s public education system may seem to present conditions and performance for students of disadvantaged groups to be right around the national average, there certainly exists many inequalities present in some of the aforementioned statistics.
In terms of funding, while there does seem to be inflation in regards to the high end of the per pupil expenditure within Montana considering the smaller enrollment sizes of its counties, there does exist large variation for per pupil expenditure within the state, ranging from $99,000 for the Pleasent Valley Elementary School District, all the way down to $8,098 for the Kinsey Elementary School District. Even though there is a complete lack of charter schools in the state to siphon off portions of state and federal funding, the per pupil expenditure is below the national average with a difference of $1,203.
The state also seems to be failing its American Indian/Alaskan Native students, which represents an immense issue considering these students represent 11.0% of the Montana student body in comparison to the national average of 0.9%. While many factors contribute to this complex issue, Native American students are not receiving the educational support they deserve, as evident by their 68.27% graduation rate compared to White students’ graduation rate of 88.71%.
One issue that could relate to the unfortunate academic experience of Native Americans in Montana public schools is lack of diversity in these schools. Montana educates the 4th highest percentage of white students in the United States (77.7%), while educating some of the lowest proportions of minority students in the nation, including Black, Hispanic, and Asian students. More specifically, they educate the lowest percentage of black students in the country (0.8%) and the second lowest percentage of Asian students in the country (0.7%). In addition to this, Montana’s percentage of English Language Learning students lands at 2.4%, compared to the national average of 10.2%.
{Statistics used in this section are all previously cited}
Relevant Current Events:
Changes in Conditions for Early Career Teachers:
Based on the previously mentioned statistics and information, teacher conditions in Montana are undoubtedly subpar. With an average teacher salary (in current US dollars) of $52,894 in 2020 compared to the national average of $65,090, as well as the complete lack of a merit pay program to incentivize excellent teachers, there are a major causes of teacher shortages already exacerbated by the Covid-19 pandemic.
In order to combat these teacher shortages, the Montana Board of Public Education and Office of Instruction are considering proposals to reduce certain requirements and increase potential opportunities for teachers to obtain a teaching license in the state of Montana.
The proposed changes would introduce alternative pathways and would significantly cut down the required time needed to earn a teaching license from five years of experience to none. As expected, these proposals are facing strong pushback in regards to their broad terminology, their ability to particularly assist rural schools in obtaining more teachers, and the potential deterioration of the state’s current teacher quality standards {33}.
As another measure to attract new teachers, 19% of Montana’s school districts are taking part in an incentive program to raise starting teacher pay for the 2022-23 school year via the TEACH Act. Teachers would be eligible to receive these raises in the first three years of their teaching career. While the state’s incentive program offers districts roughly $3,500 per teacher receiving a raise, it requires most districts to equate the raise to 70% of a mid-career salary. This element of the Act presents economic inequalities in terms of which districts are able to supplement the state’s funding to participate in this program, especially with a state with such a wide range of per pupil expenditure by county {34}. Nevertheless, this program is a step in the right direction in terms of incentivizing and rewarding Montana’s early career teachers.
High Lead Levels in School Water Fountains:

Image 5. Montana student at a water fountain [35].
In recent state-mandated water quality testing, roughly half of Montana schools who had turned in samples by February 18th reported high levels of lead. Montana state officials have stated that 589 school buildings have lead levels higher than the threshold of 15 ppb.
This presents an extreme problem to students’ health, considering that lead is a toxic metal able to cause severe organ and nervous system damage. Unfortunately, children are extremely vulnerable to lead poisoning, which can cause learning, speech, and behavioral problems for students who drink it in addition to the previously mentioned health risks.
This issue presents yet another problem exposing Montana’s wide range of per pupil expenditure by county. Schools falling below the average per pupil expenditure $11,984 will have a much tougher time accumulating enough funds to combat this issue by fixing their water fountains. These schools may have to resort to seeking federal aid passed last year or add these repairs to their already extensive list of self-payed capital improvement projects {36}.
Literature Cited:
https://docs.google.com/document/d/1H_S3jXKc_GnnSyWNFkjyNDEskLHxWtQVLj4d4zXFTnI/edit?usp=sharing