
New Hampshire Education Profile
Nicholas S. Werner – Bowdoin College
Published May 9th, 2022
Student Population and Attendance
(“Digest of Education Statistics,” 2018; “NAEP Report Cards” 2019)
- Total public school student population:
- 194,000 students between the ages of 5 and 17
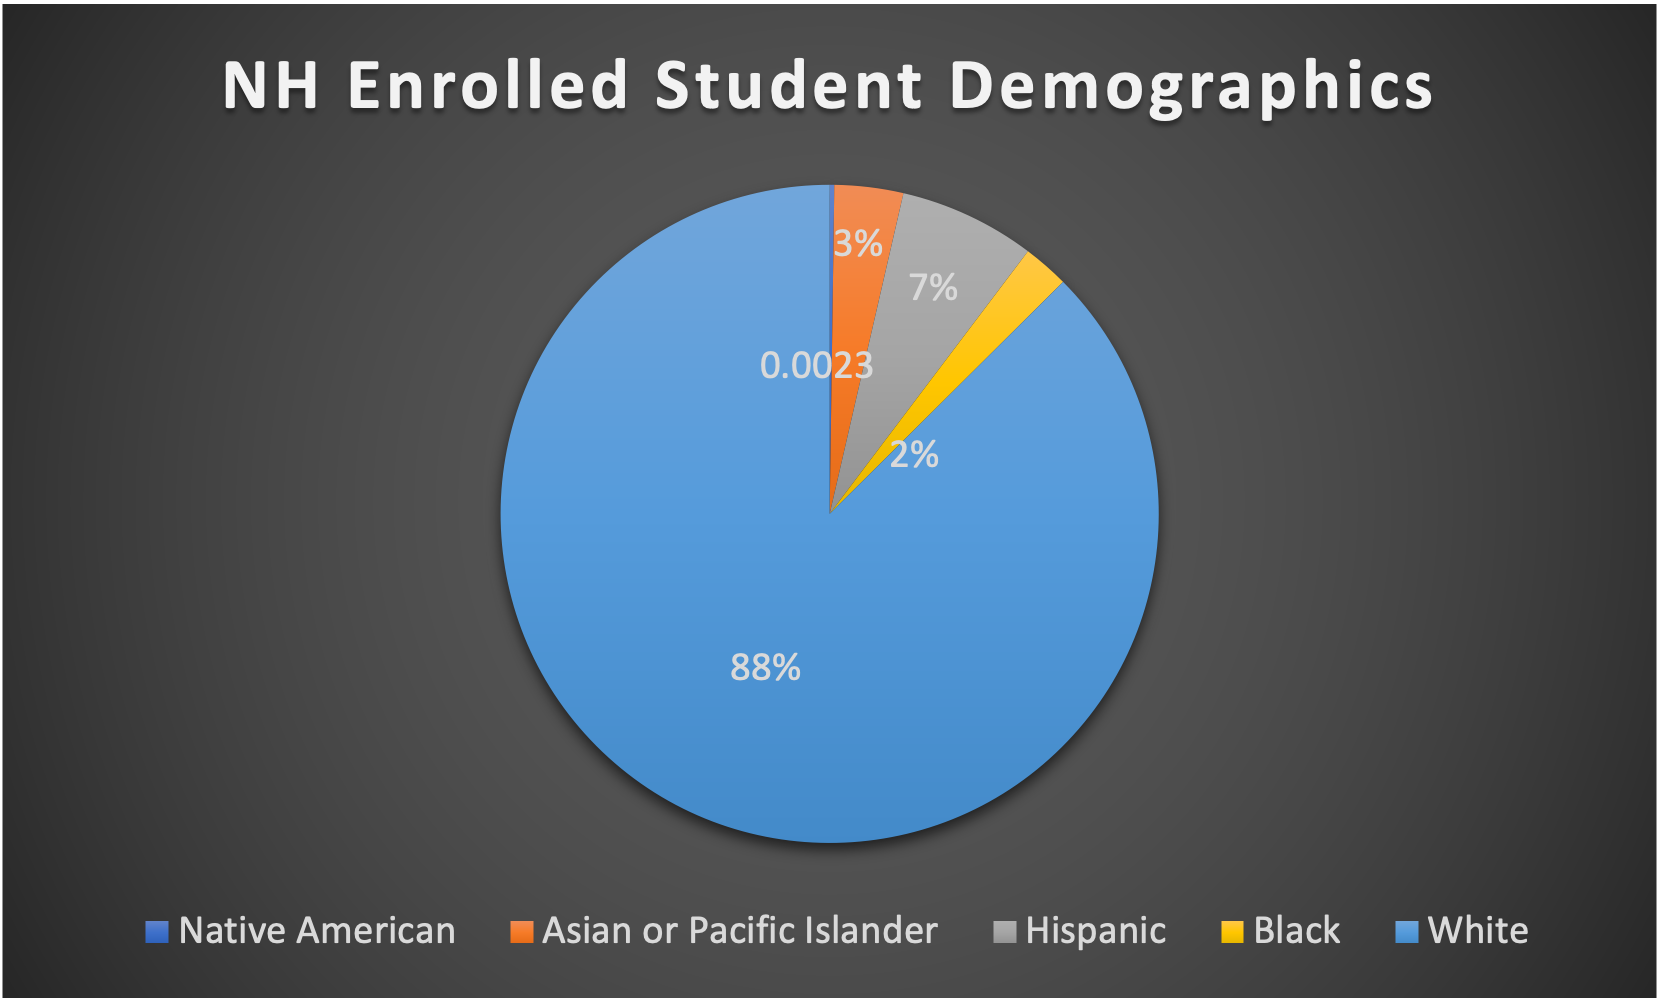
- Student population demographics:
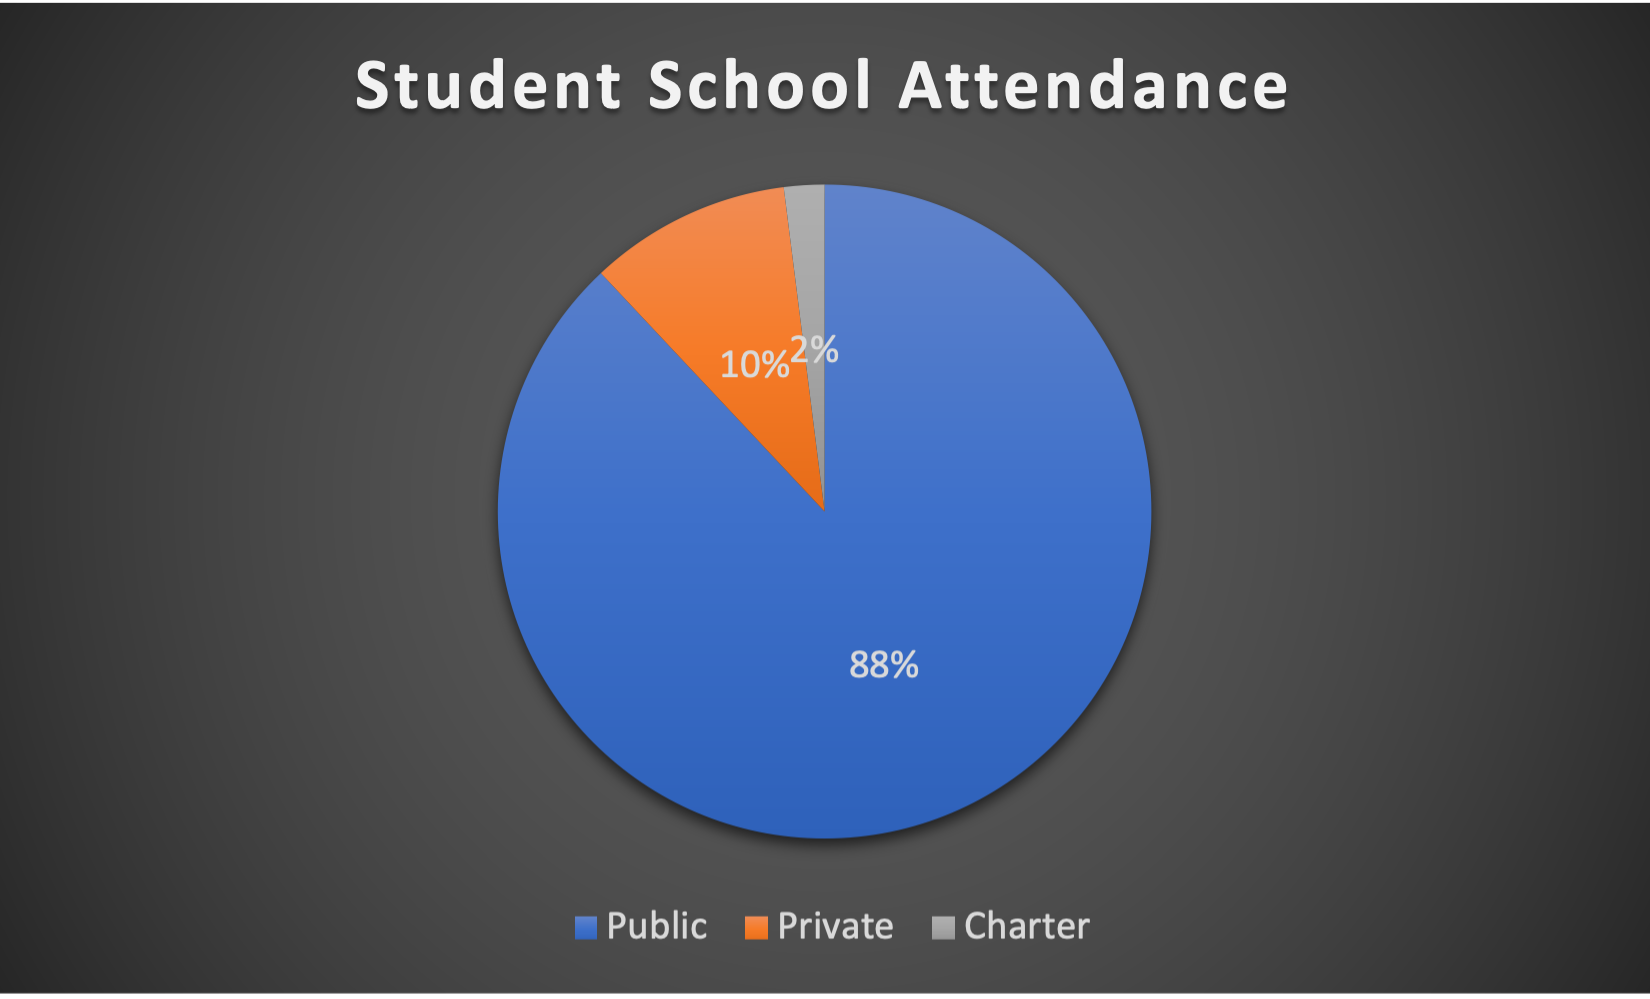
- Public, Private, and Charter School attendance:
Financial Profile
(“NH School and District Profiles” 2018; “ELSI – Elementary and Secondary Information System” 2021; “Digest of Education Statistics,” 2018; “School Funding” 2022)
- Total state public education budget:
- Annual budget of $2,942,000,000 for primary and secondary education.
- State per-pupil expenditures:

-
- New Hampshire per-pupil expenditures of districts are included in describing individual districts that spend the highest and lowest amounts on their students.
Graduation Rates and Proficiency
(“Fast Facts” 2018; “NAEP Report Cards” 2019)
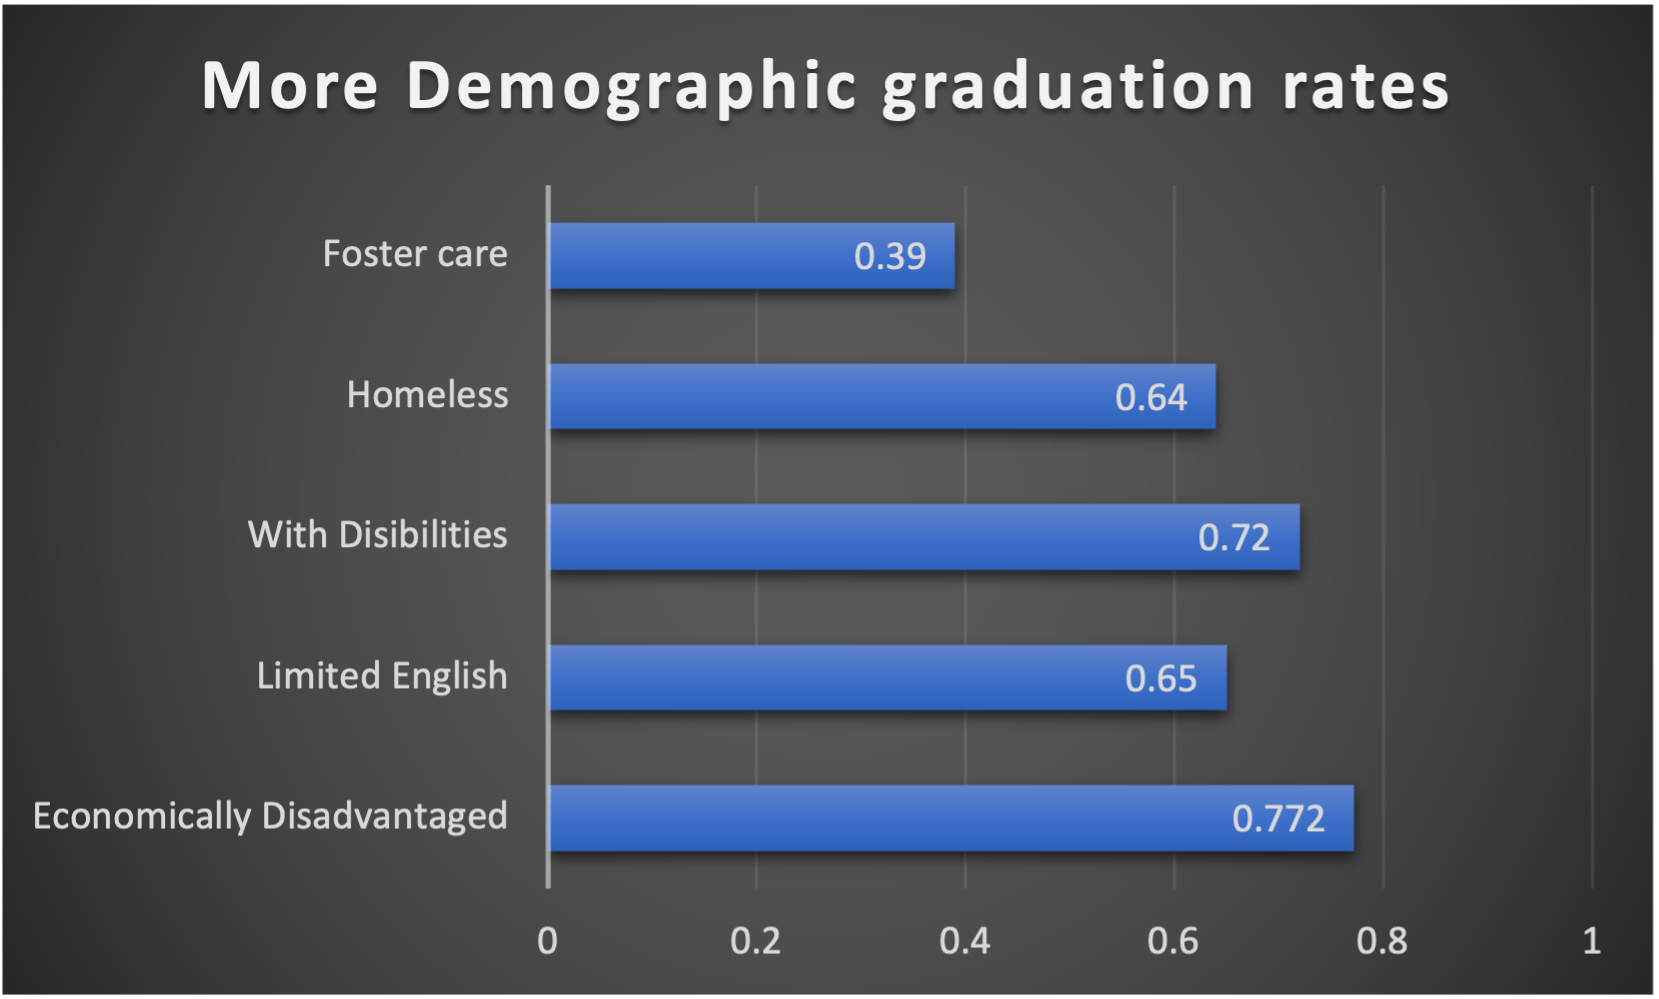
- Graduation rates (total, and by demographics):

- Subject matter assessed by accountability measures:
- Average NH scores on standardized tests by grade Compared to national average: Math, Reading, and Science.
| Math | Reading | Science | |
| US Grade 4 | 240 | 219 | 153 |
| NH Grade 4 | 245 | 224 | 165 |
| US Grade 8 | 281 | 262 | 153 |
| NH Grade 8 | 287 | 268 | 165 |
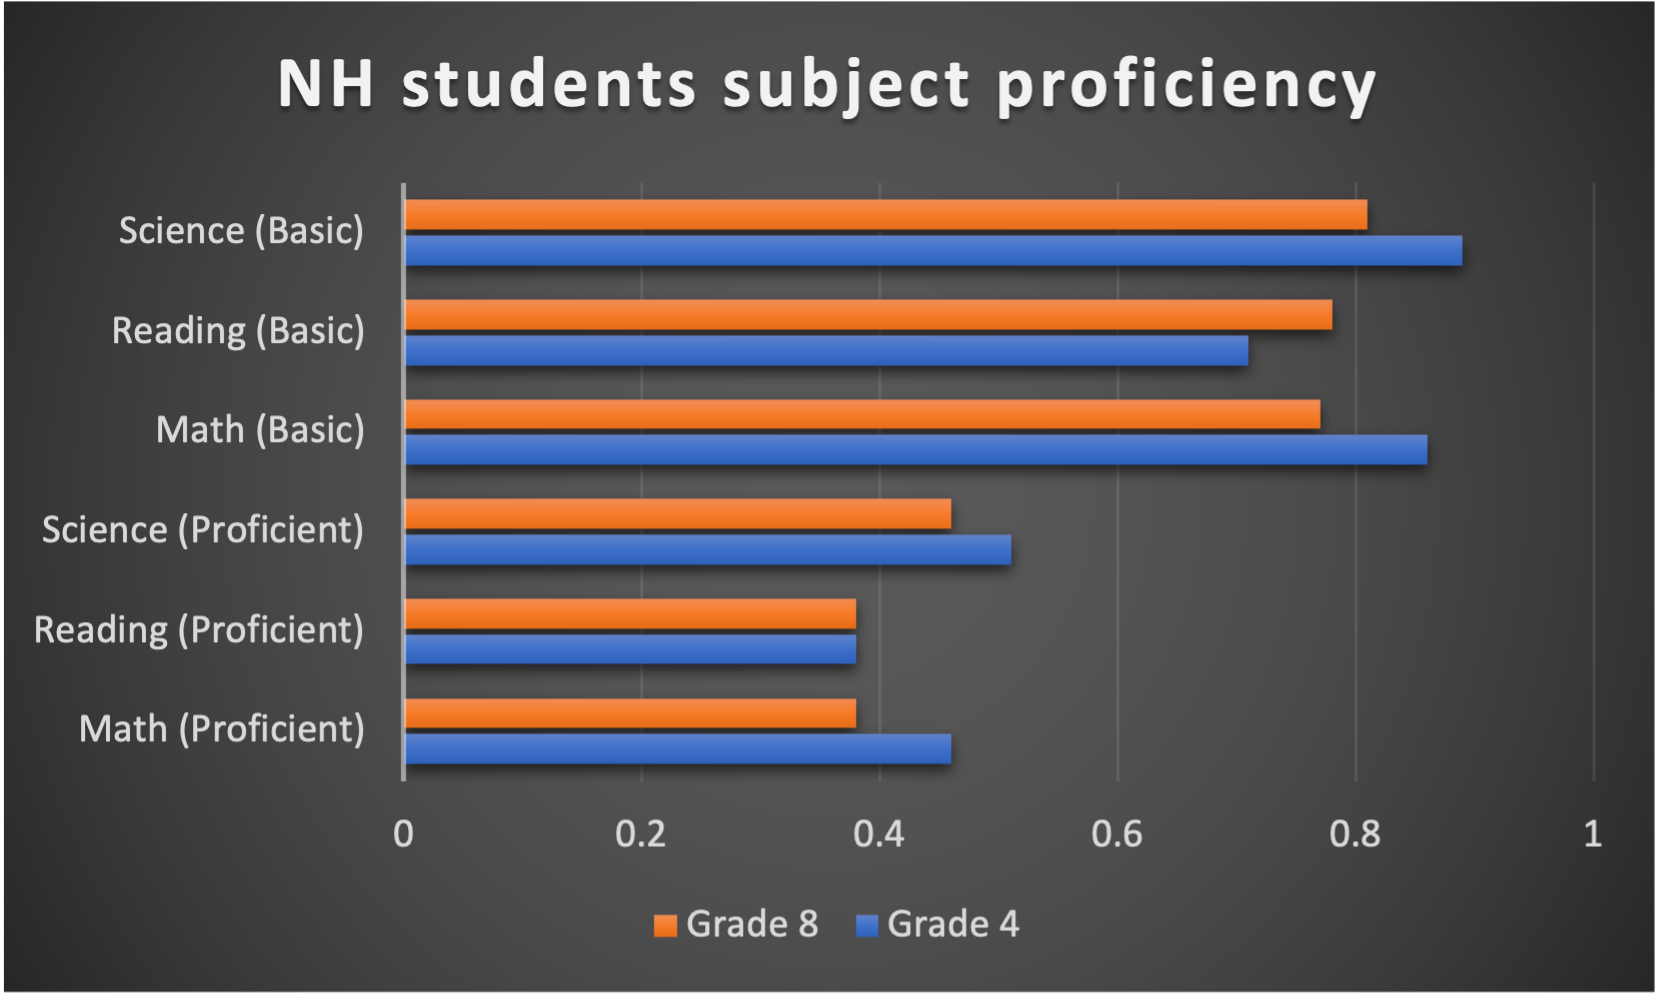 Percent of students with proficient and basic knowledge on standardized tests: Math, Reading, and Science:
School Profiles
(“NH School and District Profiles” 2018; “New Hampshire: Accountability System Fact Sheet;” “Fast Facts” 2018)
- Number of charter schools and percentage of students served:
- 40 operational charter schools, serving 2.2% of the total student
- Adoption of Common Core:
- Has adopted the Common Core standards
- Adoption of Next Generation Science Standards:
- Has adopted Next Generation Science Standards as the foundation for science learning in the state
- Accountability measures:
- Every Student Succeeds Act of 2015 established a standard for accountability in New Hampshire. Accountability is meant to assess school success through outcomes. Accountability is measured through:
- Math and Reading standardized test scores
- Graduation rates
- Dropout rates
- Schools are ranked on a four-tier system with 3 and 4-tier schools being eligible for intervention.
- Every Student Succeeds Act of 2015 established a standard for accountability in New Hampshire. Accountability is meant to assess school success through outcomes. Accountability is measured through:
- Permissible voucher use:
- Town Tuitioning Program – Allows towns that lack schools at a district level to pay for students to attend public or approved private schools of their choosing
- Voucher dollar amounts and percentage of students served:
- 17 total students served, a maximum of $14,000 per student
Teacher Profiles
(“Digest of Education Statistics,” 2018)
- Average teacher salary:
- $57,253 average salary of elementary and secondary education teachers
- Presence of teachers’ unions/collective bargaining:
- AFT is present in New Hampshire. NEA is also present with over 16,000 education employees
- Merit pay for teachers:
- No discernible merit pay
- Teacher evaluation methods and measures:
- All New Hampshire educators must hold a bachelor’s degree, complete a state-approved teacher preparation program, and pass the required content and subject area examinations (“The New Hampshire Teaching and Certification Resource” 2022).
- Teachers are evaluated in annual evaluations, student achievement, evaluations factor into tenure selection, and teachers are eligible for dismissal due to evaluations (“Teacher Evaluation Policy in New Hampshire: Where Is New Hampshire in Implementing Teacher Effectiveness Policies?” 2016).
Persistent Inequities
New Hampshire, as a small and largely rural state, is a large majority white. At 88% white, the remaining 12% of students are majority Hispanic at 7%. These disparities are mirrored in graduation rates of demographics with a state average graduation rate of 88.4%, white students graduating at a rate of almost 90% but around only three-quarters of black students graduating secondary school. While high proficiency and basic knowledge percentages bolster New Hampshire’s above-average graduation and success rates, it is clear that a high proportion of privileged students overshadows unassisted underprivileged individuals.
Students from difficult and underprivileged backgrounds graduate at an alarmingly lower rate than the state average. Economically disadvantaged students see a graduation rate of 77% with a drop off to 64% for homeless students. Students with limited English only graduate at a rate of 65% while students with disabilities see a rate of 72%. Most shockingly, students in foster care graduate at only a rate of 39%, less than half that of the national average. While New Hampshire may serve its students who need minimal extra help well, the New Hampshire Public Education System fails to give the assistance its disadvantaged students need and deserve to close these disparities.
In compliance with the Every Student Succeeds Act, New Hampshire’s attempts to raise graduation rates and proficiency are seen in the evaluation of school systems’ ability to teach to tests and retain students. While attention to lower graduation rates of schools sees overlaps with lower graduation rates of student demographics, this approach blames larger school systems and does not appropriately analyze the needs of individual students and communities. Blanket requirements encourage blanket solutions which only perpetuate social and economic inequities in students’ education.
New Hampshire Public School Funding
(Albertson-Grove 2022; Gibson 2022)
While New Hampshire spends more than the national average per student at a statewide average of $17,197, the discrepancy between per-pupil expenditures by district is alarming. With a high average of $57,058 and a low of $8,590, spending is drastically affected by the district. The state average is skewed toward a larger average by a small collection of higher-paying and better-funded schools while a large proportion of students are forced to receive education at a value that is a mere fraction of their peers.
A large part of this inequity is a result of New Hampshire receiving very little federal funding, with two-thirds of individual districts’ funding coming from property taxes. While New Hampshire has several wealthier metropolitan and urban areas, a majority of the state is rural and lower-income. With a large population of rural lower-income families, high taxes on valuable property are not a luxury for municipalities. Cities like Portsmouth see much higher property taxes and higher land value than cities like Manchester and therefore receive drastically larger budgets for each school year. With minimal State and even smaller Federal Funding, towns and districts are forced to fund their schools. Some can with high taxes and wealthy taxpayers, but others cannot.
A lack of funding results in struggling schools and not infrequent drastic action. Recently, Croydon Public Schools cut their annual budget in half going from $1.7 million to a mere $800,000 in March. Conservative voters saw it as a win for low tax promises and minimal government intervention, but the choice leaves children in schools that are forced to cut staff, reduce extra programming and reshape their skeletal curriculum.
While efforts to reverse this drastic cut are well underway, the intervention has forced families to consider private or alternative schools for their children if they hope for true quality education. New Hampshire is but another example of the political battle over school choice and the detriment it can have for individual communities. Education funding is further placed on individual districts. For those that can afford to provide quality education, their communities are further supported for their success and resources, but for those that can not, their schools are forced to operate on smaller and smaller budgets as those that can afford to, find alternate options for their children.
Bibliography
Albertson-Grove, Josie. 2022. “How We Pay for Schools in New Hampshire, and Why It Costs so Much.” New Hampshire Union Leader. May 7, 2022. https://www.unionleader.com/news/education/how-we-pay-for-schools-in-new-hampshire-and-why-it-costs-so-much/article_655440ca-f60c-5b48-8303-e17e0f21bd6d.html.
“Digest of Education Statistics,.” 2018. Ed.gov. National Center for Education Statistics. 2018. https://nces.ed.gov/programs/digest/.
“ELSI – Elementary and Secondary Information System.” 2021. Nces.ed.gov. National Center for Education Statistics. 2021. https://nces.ed.gov/ccd/elsi/default.aspx?agree=0.
“Fast Facts.” 2018. Ed.gov. National Center for Education Statistics. 2018. https://nces.ed.gov/fastfacts/.
Gibson, Sarah. 2022. “Croydon Cut Its School Budget in Half. Inside the Historic Push to Reverse That Decision.” New Hampshire Public Radio. May 6, 2022. https://www.nhpr.org/nh-news/2022-05-06/croydon-school-budget-cuts-students-revote.
“NAEP Report Cards.” 2019. Nation’s Report Card. National Assessment of Educational Progress. 2019. https://www.nationsreportcard.gov/data_tools.aspx.
“New Hampshire: Accountability System Fact Sheet.” n.d. New Hampshire Department of Education. U.S. Chamber of Commerce Foundation. Accessed May 9, 2022. https://aasa.org/uploadedFiles/Policy_and_Advocacy/ESSA_Resource_Library/State_Accountability_Primers/State-Accountability-Primer-NH.pdf.
“NH School and District Profiles.” 2018. New Hampshire Department of Education. 2018. https://my.doe.nh.gov/profiles/profile.aspx?oid=&s=&d=&year=&tab=accountability.
“School Funding.” 2022. NH School Funding Fairness Project. 2022. https://fairfundingnh.org/learn/school-funding/#:~:text=While%20New%20Hampshire.
“Teacher Evaluation Policy in New Hampshire: Where Is New Hampshire in Implementing Teacher Effectiveness Policies?” 2016. April 2016. https://www.nctq.org/dmsView/Evaluation_Timeline_Brief_New_Hampshire.
“The Condition of Education.” 2018. NCES. National Center for Education Statistics. 2018. https://nces.ed.gov/programs/coe/.
“The New Hampshire Teaching and Certification Resource.” 2022. Teacher Certification Degrees. 2022. https://www.teachercertificationdegrees.com/certification/new-hampshire/#:~:text=All%20New%20Hampshire%20educators%20must.