
Kevin Murray
New York is one of the most populated states in the U.S. and New York City is one of, if not the most, popular city in the world. Therefore, New York’s education statistics and demographics are interesting to many, including myself as I am from New York. Keep in mind that the data is for all of NY, not just NYC so the rural towns in upstate NY and the suburbs throughout the state are also accounted for in the data report.
Data
Student Funding
- In NY, the total public school student population is 2,512,973. This makes up five percent of the 50,072,000 public school students in the U.S.
- In the 2017-18 school year, New York’s public education budget was $69,151,396,000. This comprised 9.4 percent of the $734,876,044,000 budget for all U.S. public schools in that year.
- On average, each student expenditure is about $25,500. These numbers are from the 2017-18 year adjusted to 2019-20 dollars. This number is very high as the average per pupil expenditure in the U.S. is $12,624.
- The largest budget in New York is the Amagansett Union Free School District at $86,174. The lowest per pupil expenditure is the General Brown Central School District at $14,471 (WalletHub).
(Data from this section is all from NYSED)

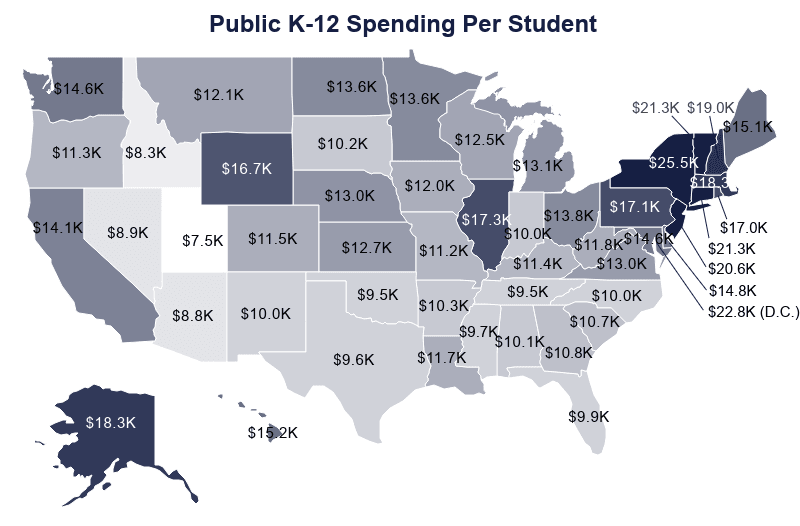
Source: EducationData.org (2022)
The top graph shows the difference between the U.S. per pupil expenditure and New York’s per pupil expenditure. New York’s budget greatly exceeds the budget of the average expenditure throughout the country. The bottom graph depicts the per pupil expenditure for every state in the U.S. Recall that the average budget is $12,624. Notice that New York has the highest budget out of all 50 states. Additionally, there seems to be a lot more spending in the northeast. This is interesting because Horace Mann’s common schools originated in Massachusetts.
Student Demographics
- Race/ethnicity:
- White: 1,036,391 (41%)
- Hispanic: 715,474 (28%)
- Black/African American: 413,883 (16%)
- Asian: 254,476 (10%)
- Other: 92,749 (5%)
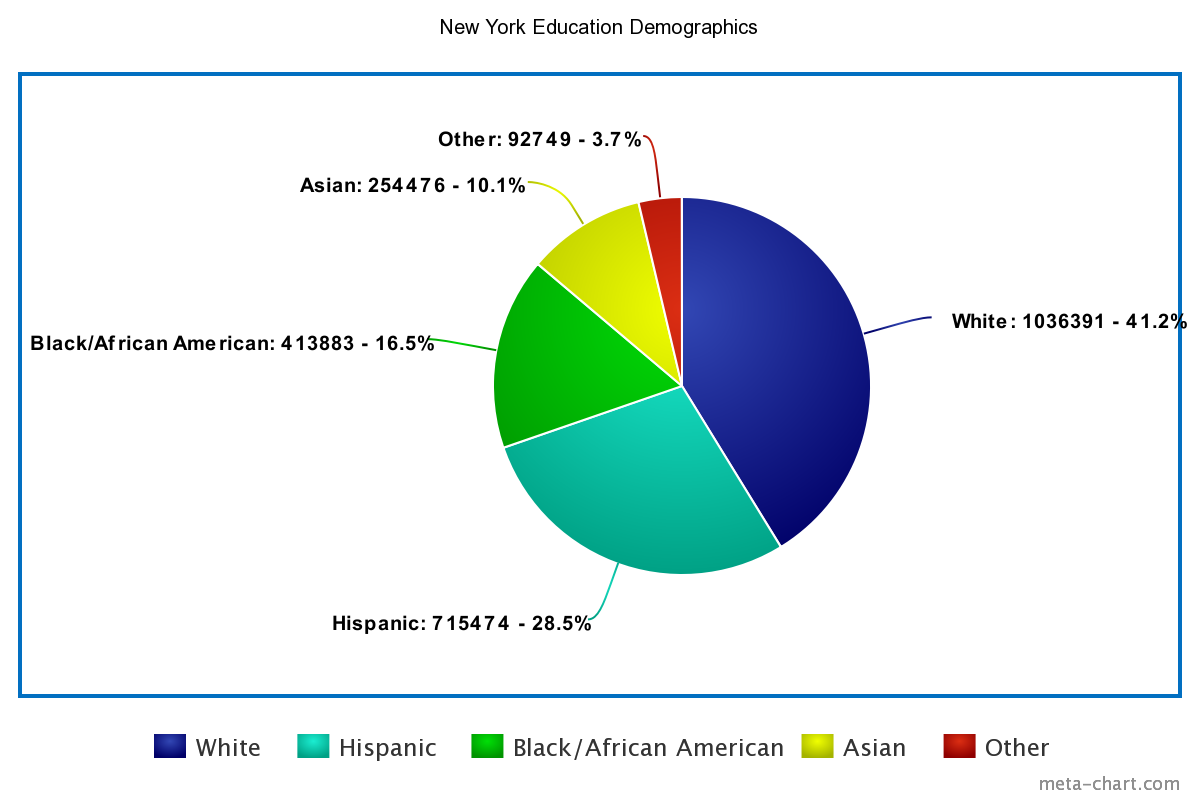
The graph above simply puts all the demographic statistics above into a visual to show the differences in race in New York public schools.
- English Language Learners: 240,035 (10%)
- Students With Disabilities: 459,039 (18%)
- Economically Disadvantaged: 1,443,603 (57%)
(Data for this section is all from NCES)
Graduation Rates
- Total: 86%
- White: 90%
- Hispanic: 80%
- Black/African Americans: 80%
- Asian: 92%
- English Language Learners: 61%
- Students With Disabilities: 64%
- Economically Disadvantaged: 81%
(Data from this section is all from NCES)
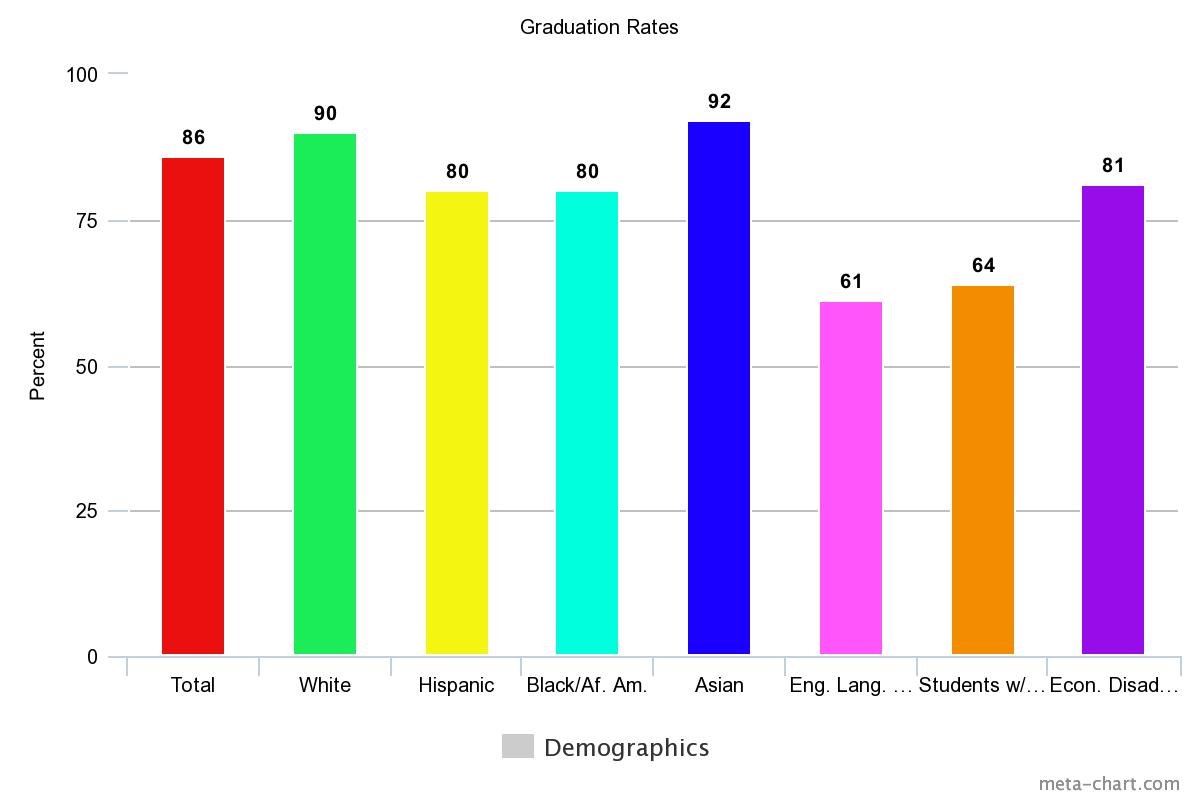
The graph above shows graduation rates for several different demographics. Notice the difference in graduation rates for minorities as well as the low rates for English language learners, students with disabilities, and economically disadvantaged students.
School Choice

- Public vs. Private School Attendance:
- U.S. Public: 50,072,000
- U.S. Private: 5,007,200
- NY Public: 2,512,973
- NY Private: 351,816
- Charter Schools:
- US: 7,427 (serves 7% of U.S. students)
- NY: 326 (serves 5% of NY students)
- Vouchers: N/A. New York does not have private school voucher programs.
(Data from this section is all from School Choice Week)
Teachers

- Average Yearly Teacher Salary:
- US: $63,645
- NY: $79,588
- Teachers Unions:
- United Federation of Teachers: Around 150,000 teachers in NYC alone
- Merit Pay:
- There used to be bonuses ranging from $7,500-$20,000 but NY took a step back a few years ago
- Evaluation:
- Common Core exams
- NYS Tests
- Regents Exams
- Measures of Teacher Practice (MTOP) rubric
(Data from this section is all from NCES)
Analysis

When analyzing data for New York public education including student funding, demographics, graduation rates, school choice, and teacher metrics, it is evident that inequalities exist. The most intriguing set of data was the student demographics. In New York, the race demographics are very similar to the United States race demographics. Additionally, student expenditure in New York is twice as much as the average per pupil expenditure in the United States. However, the graduation rates for minorities are much lower than the white graduation rates. Also, English language learners and students with disabilities graduate at a much lower rate. So, if we eliminated the possibility of underfunding and the diversity of New York public schools aligns with the demographics of the United States, then why are the graduation rates lower for minorities, English language learners and students with disabilities?
One reason for the difference in graduation rates among demographics could be the growing opportunity gap. One of the issues in education that we have discussed in this course is the gap between high and low achievement in the classroom. Recently, the distinction between “good” students and “bad” students has grown in terms of test scores, graduation, college acceptance, etc. The achievement gap is fostered by the opportunity gap. Therefore, when students are given unequal opportunities (i.e. school choice), differences in data arise like the graduation rate of minorities and students with needs. Some attempts have been made by advocates for academic equality to close the achievement gap. For example, conventions and workshops have been created to encourage equality. Also, there have been donations made to try to close the gap. Regardless of the efforts, equality will likely be an issue for a long time as the political divide in the United States continues to grow.
(The information in these paragraphs is from Williams’s op-ed “How New York Can Address Its Dismal Racial Achievement Gap in Education.”)
Current Events

In March of 2022, the New York State Education Department proposed that private schools can use test scores to show that they are academically “equivalent” to public schools. Up until this proposal, private schools had to prove that they were equivalent to public schools through curriculum review. With the potential legislation, curriculum inspections would not be required. One of the most criticized types of schools has been the Jewish yeshivas in New York City. The supervision has been called for throughout the state and country as many believe that private schools have not been preparing students for higher education. I have experienced firsthand the criticism of these private schools because I live in New York and attended a private Catholic high school in New Jersey.
This current event for New York education is relevant to the data compiled above. The divisive issue of school choice is broached in the proposal and the result can have an effect on the number of students in New York public schools and the number of students in New York private schools. As of now, there are 2,512,973 public school students in New York and 351,816 private school students. However, if private schools are not required to provide a description of their curriculum, they will be able to market their schools better and not have to be as transparent as before. As a result, there could be an increase in the number of students attending private school and a decrease in the number of public school students in New York. Despite public school attendance dropping, there is a case for this scenario to be okay. Assuming the per pupil expenditure stays the same, there would be more funding per student, which could help close the achievement gap. But when old problems are solved, sometimes new problems can arise. It has yet to be seen what these new problems could be, but New York needs to be ready for everything in the near future.
(The information in the first paragraph is from Stern’s article “NY State Would Allow Private Schools to Use Test Score, More to Show Academic Equivalency.”)
Sources
https://docs.google.com/document/d/16KVaydzM6s84WeCNa52YvTXaBkxAVegAeZD4_hLsEFU/edit