The State of Education in North Carolina
Charlie Everhard
Fast Facts:
- Total public school population: 1,500,000 students
- Total private school population: 119,000 students
- Total charter school population: 126,000 students
- Total state public education budget: $16.1 Billion
- Student demographics:
-
- North Carolina School Finances. https://ncreports.ondemand.sas.com/srcfinance/
- Public Schools First NC. https://www.publicschoolsfirstnc.org/

How does North Carolina stand up to states nationally?
- Average per pupil expenditure: $9,277
- (High: Hyde County NC- $20,601)
- (Low: Davidson County NC- $8,008)
- Average national per pupil expenditure: $13,597
- Average annual teacher salary: $54,392
- Average annual teacher salary nationally: $63,645
-
- Marissa Perino, Andy Kiersz, and Madison Hoff, “Here’s how much every US state pays its
teachers and how much they spend on each student.”, Insider, May 7, 2021,
https://www.businessinsider.com/teacher-salary-in-every-state-2018-4#method-and-data-s
Ource-52. - “North Carolina Demographics”, The Nation’s Report Card, https://www.nationsreportcard.gov/profiles/stateprofile/overview/NCcti=PgTab_Demographics&chort=1&sub=MAT&sj=NC&fs=Grade&st=MN&year=2019R3&sg=Gender%3A+Male+vs.+Female&sgv=Difference&ts=Single+Year&tss=2019R3&sfj=NP.
- North Carolina School Finances, https://ncreports.ondemand.sas.com/srcfinance/state?year=2020&lang=en.
- “Per Pupil Expenditures in North Carolina”, The Annie E. Casey Foundation Kids Count Data Center, https://datacenter.kidscount.org/data/tables/2271-per-pupil-expenditures#ranking/10/any/true/1769/872/4746.
- Marissa Perino, Andy Kiersz, and Madison Hoff, “Here’s how much every US state pays its
How can we interpret this?
North Carolina ranks 47/50 among US states in per pupil spending, which is an embarrassing number considering the current rising economic output and growth of the state. It is over $4000 lower than the national average, and varies based on county and main demographic of students served at a specific school. On average, schools that serve more underprivileged students in North Carolina and schools in more urban regions of the state spend more per pupil than those that do/are not, yet still less than the national average. This is likely a cause for lower graduation rates of minority and marginalized students in comparison to White and Asian students in the state, as well as schools in urban counties (Wake, Mecklenburg, Guilford) typically seeing more funding to their students. On top of this, teachers in North Carolina are paid about $10,000 less than the national average. This makes incentives for teachers to teach in NC very low, and schools in NC and nationally have notorious issues with being understaffed. Understaffing can lead to the elimination of certain types of classes, programs, and extracurriculars, the lack of these being detrimental to student success.
This trend points at a lack of funding towards public education as a whole in the state of North Carolina. Although Governor Roy Cooper is enacting initiatives to raise school funding to increase things like per pupil spending and teacher salaries, the state is still struggling with the allocation of funding. In the fiscal years of 2022 and 2023, he plans to budget hundreds of millions of dollars to public teacher salaries “to decrease pay disparity between educators and similarly credentialed and experienced professionals in other fields”. The issue, however, is far from being solved. In addition to this, the Leandro Case in regards to Mecklenburg County ruled that students across the state were not receiving equal educational opportunities due to the inequity in school funding back in 1994, yet initiatives as recently made as the summer of 2021 are being enacted to see this case through. These initiatives include a better and more monitored system of teacher and administrator development, along with a finance system geared better to the needs of individual districts, schools, and students. North Carolina lawmakers, schools, and teachers have been battling over this case for nearly thirty years, and it fits into the greater struggle to better account for underrepresented children and to more efficiently allocate funding for public schooling in NC.
Testing, Accountability Measures, and Teaching Standards:
- Presence of teachers unions:
- The North Carolina Association of Educators (NCAE) is a coalition of educators, students, activists, workers, parents, neighbors, and friends who believe in opportunity for all students and in the power of public education to transform lives and create a more just and inclusive society.
- NC is one of just two states prohibiting state and local governments from entering into collective bargaining agreements with school administrators and educators.
- Merit pay for teachers:
- NC uses a “Value added method” to calculate teacher performance based on test scores demonstrated by students, which is generally disagreed with by teachers but agreed with by the public. This system rewards teachers based on how well students perform on standardized tests.
- Teacher evaluation methods and measures:
- NC uses the Educator Effectiveness Model, which judges teacher performance largely on student growth and performance.
- Testing and student proficiency requirements:
- There are end of grade assessments in grades 3-8 in Reading (ELA) and Math, and Science assessments in grades 5 and 8.
- Pre ACT, ACT, and the WorkKeys assessment are required in grades 10-12.
- Students must earn 22 credits in “Future-ready” courses, designed to prepare students for college.
- As of February 2022, NC uses the North Carolina Standard Course of Study for all public schools, which emphasizes a well rounded education in a wide variety of subjects.
- Students must complete at least three credits of science, including physical science, biology, and environmental science, in order to graduate from a North Carolina public high school.
Assessments required by grade level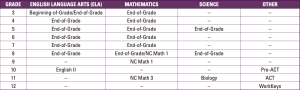
-
- North Carolina Association of Educators, https://www.ncae.org/.
- North Carolina Department of Public Instruction, https://www.dpi.nc.gov/.
- Public Schools First NC, https://www.publicschoolsfirstnc.org/.
- “Treating Educators Like Professionals”, North Carolina Justice Center, https://www.ncjustice.org/projects/edlaw/creating-a-shared-vision-for-nc-schools/creating-a-shared-vision-for-nc-schools-treating-educators-like-professionals/.
What do these statistics tell us?
North Carolina has strict requirements for public school teachers, in both what they’re required to prepare their students for and how they’re evaluated. The amount of material students are required to learn and the significance the state places on standardized tests makes it hard for teachers to personally express their teaching- they’re essentially forced to follow a strict script, with harsh repercussions if needs aren’t met and boxes aren’t checked off. With the stress of being teachers in a state ranked 30th in average teacher salary, being rewarded based on standardized test scores, and being in a state that doesn’t allow collective bargaining between the local government and educators, teachers in North Carolina especially are tasked with a very difficult and demanding job.
The lack of incentive to teach in North Carolina for reasons like these has created a negative cycle in North Carolina public education. Educators who feel as though they have no freedom or creative liberty in their jobs continue to leave the state or profession as a whole. No changes to help teacher salaries or teaching curriculum are being made, and students in the state, especially in underprivileged areas, continue to underperform.
Graduation Inequality in State Education:
- Graduation rates (total, and by demographic)
- Total: 87.6%
- Male: 84.9%
- Female: 90.4%
- American Indian: 85.1%
- Asian: 94.4%
- Black: 85.2%
- Hispanic: 81.7%
- Multiracial: 85.3%
- White: 90.7%
- Economically Disadvantaged: 82.2%
- Limited english proficiency: 71.4%
- Students with disabilities: 72.1%
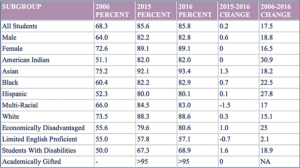
4-Year cohort graduation rate- nc results by subgroup between 2006-2016
-
- “Gaps Narrowing as NC Graduation Rate Climbs”, Public Schools of North Carolina, https://content.govdelivery.com/accounts/NCSBE/bulletins/1611005.
- North Carolina Department of Public Instruction, https://www.dpi.nc.gov/.
What is the significance of this trend?
Investment in schools, their students, and their teachers oftentimes relies heavily on how affluent the district or county is, and schools in more urban counties or whiter counties will often have much greater levels of funding and resources. Inequalities persist because schools that have higher populations of underrepresented and underprivileged students often lack the resources to properly help students reach goals past high school. Besides efforts to be made to improve school funding in regards to allocation of resources and to teacher salaries, The Leandro Court case is the only effort to structurally change the North Carolina education system. The Leandro court case is still ongoing in NC, and it has been ruled that NC has been unconstitutional in not giving all students equal educational opportunities. The State Board of Education in 2021 signed an order to implement a comprehensive plan to account for this inequality. Governor Roy Cooper also wants to help teachers’ annual salaries, which are currently ranked 30th in the nation. His fiscal years’ 2021-23 budget recommendation suggests the state appropriate $268.9 million in FY 2022 and $439.3 million in FY 2023 in teacher pay ‘to decrease pay disparity between educators and similarly credentialed and experienced professionals in other fields,’ his recommendation states. The state does not allocate a large amount of the budget to teachers’ salaries, although Governor Cooper is proposing to increase salaries by 10%.
Graduation rates among minority and marginalized students are lower nationwide because of systemic inequality in our public education system. Affluent families are able to fund their local schools better, while many urban public schools have been left underfunded and under-resourced. Choice in education also creates inequity as more affluent families will have the means to send their children to private schools. Public schools that have high minority and marginalized populations will have lower graduation rates, and that trend continues in NC. High school graduation rates have continued to climb in recent years, however. This can be attributed to policies like those being implemented in the Leandro case and general improvements to funding taking place over the course of the last decade. Graduation gaps between white and minority students have also continued to narrow, which shows that North Carolina public education is on a positive track.
In North Carolina, graduation rates are lower among marginalized and minority communities, the average per pupil expenditure rates are among the lowest in the nation, and the average teacher salary is lower than national average. Although the state is still far behind where it should be in regards to the education of its youth, real progress is being made to bring NC public education to the high levels where it should be.
References link: https://docs.google.com/document/d/1bo3HXPIcpnRRmCClhrE6N-o-ac-Np7WznCCr1Qb18z8/edit