Oregon Education Profile
By Annie Galbraith
- Total public school student population: 560,917 students (2020). This was a drop in the overall enrollment from 582,661 in 2019-2020 before the COVID-19 pandemic.[1]
- Total state public education budget: $11.478 billion [2]
- Public v. private school attendance [3]
- Public school enrollment: 559,893 students (89.2%)
- Private school enrollment: 68,041 (10.8%)
- Average per pupil expenditure: $11,340 [4]
- High/low per pupil expenditure within state: [5]
- Statewide low = $396 (at a virtual charter school)
- Statewide high = $78,891 (public school that boards students since it is in a rural area)
- Average national per pupil expenditure: $14,455 [4]
- Student demographics (race/ethnicity, English Language Learners, poverty rates)
- Race/Ethnicity [1]

-
- English Language Learners (ELL)
- 55,617 students are classified as ELL (almost 10% of all K-12 students) [1]
- In grades K-12, only grades 2,3,4, and 5 have more than 5% of their current English learners proficient in English [6]
- Houselessness in Oregon [1]
- English Language Learners (ELL)

This graph shows the graduation rates amongst Oregon students experiencing houselessness and all Oregon students. While the gap has slightly closed, there is still a large percentage difference that exists.
- Teacher Demographics [7]
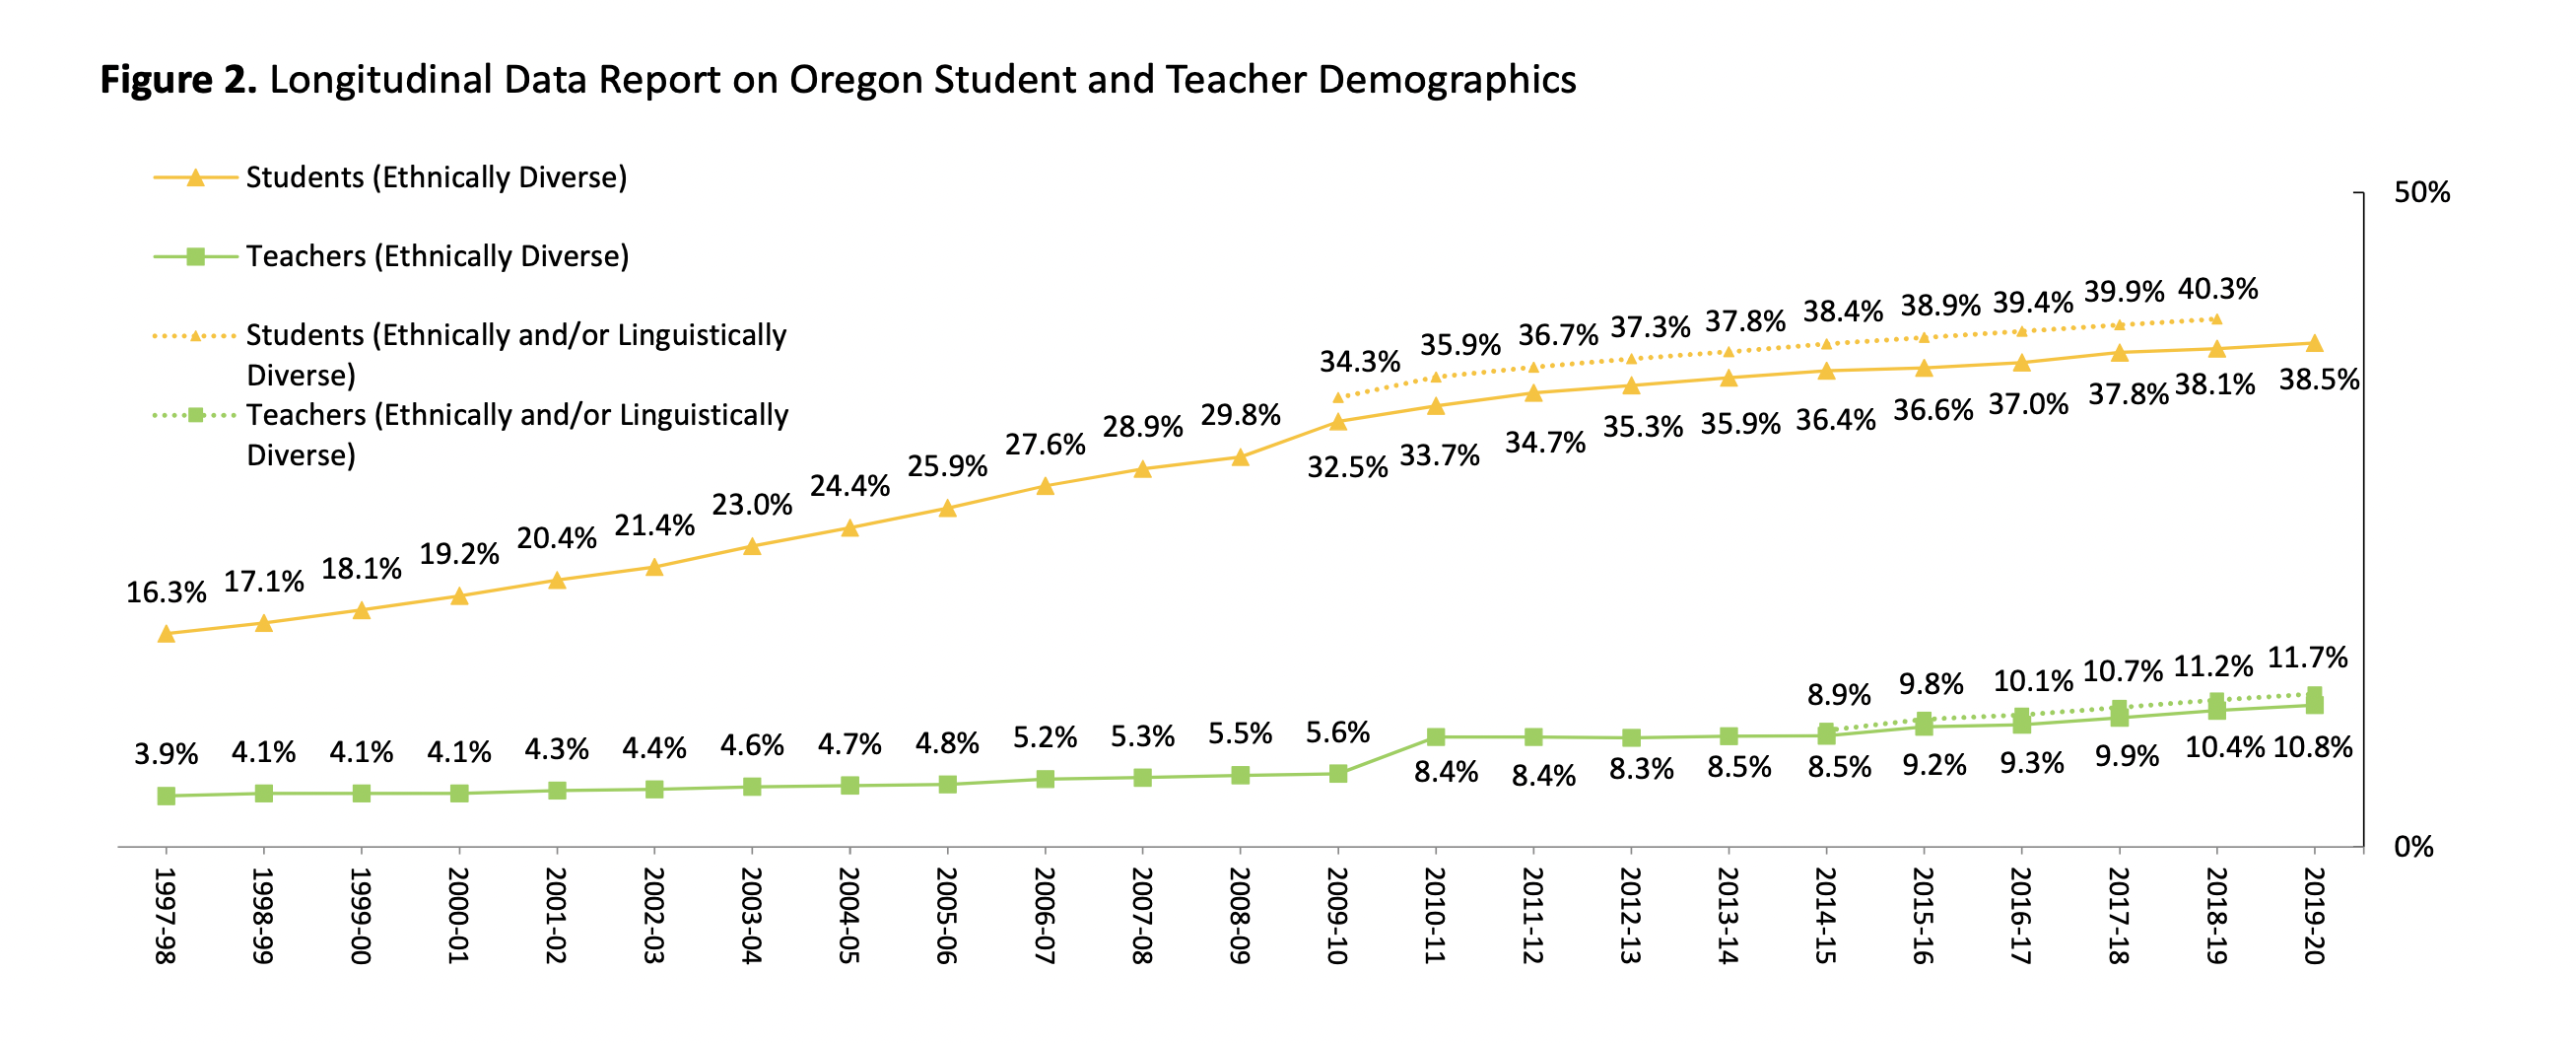
This figure shows the substantial gap between the percent of teachers considered ethnically diverse and the percent of students. In the 2019-2020 school year, 38.5% of students were classified as ethnically diverse while only 10.8% of teachers were.
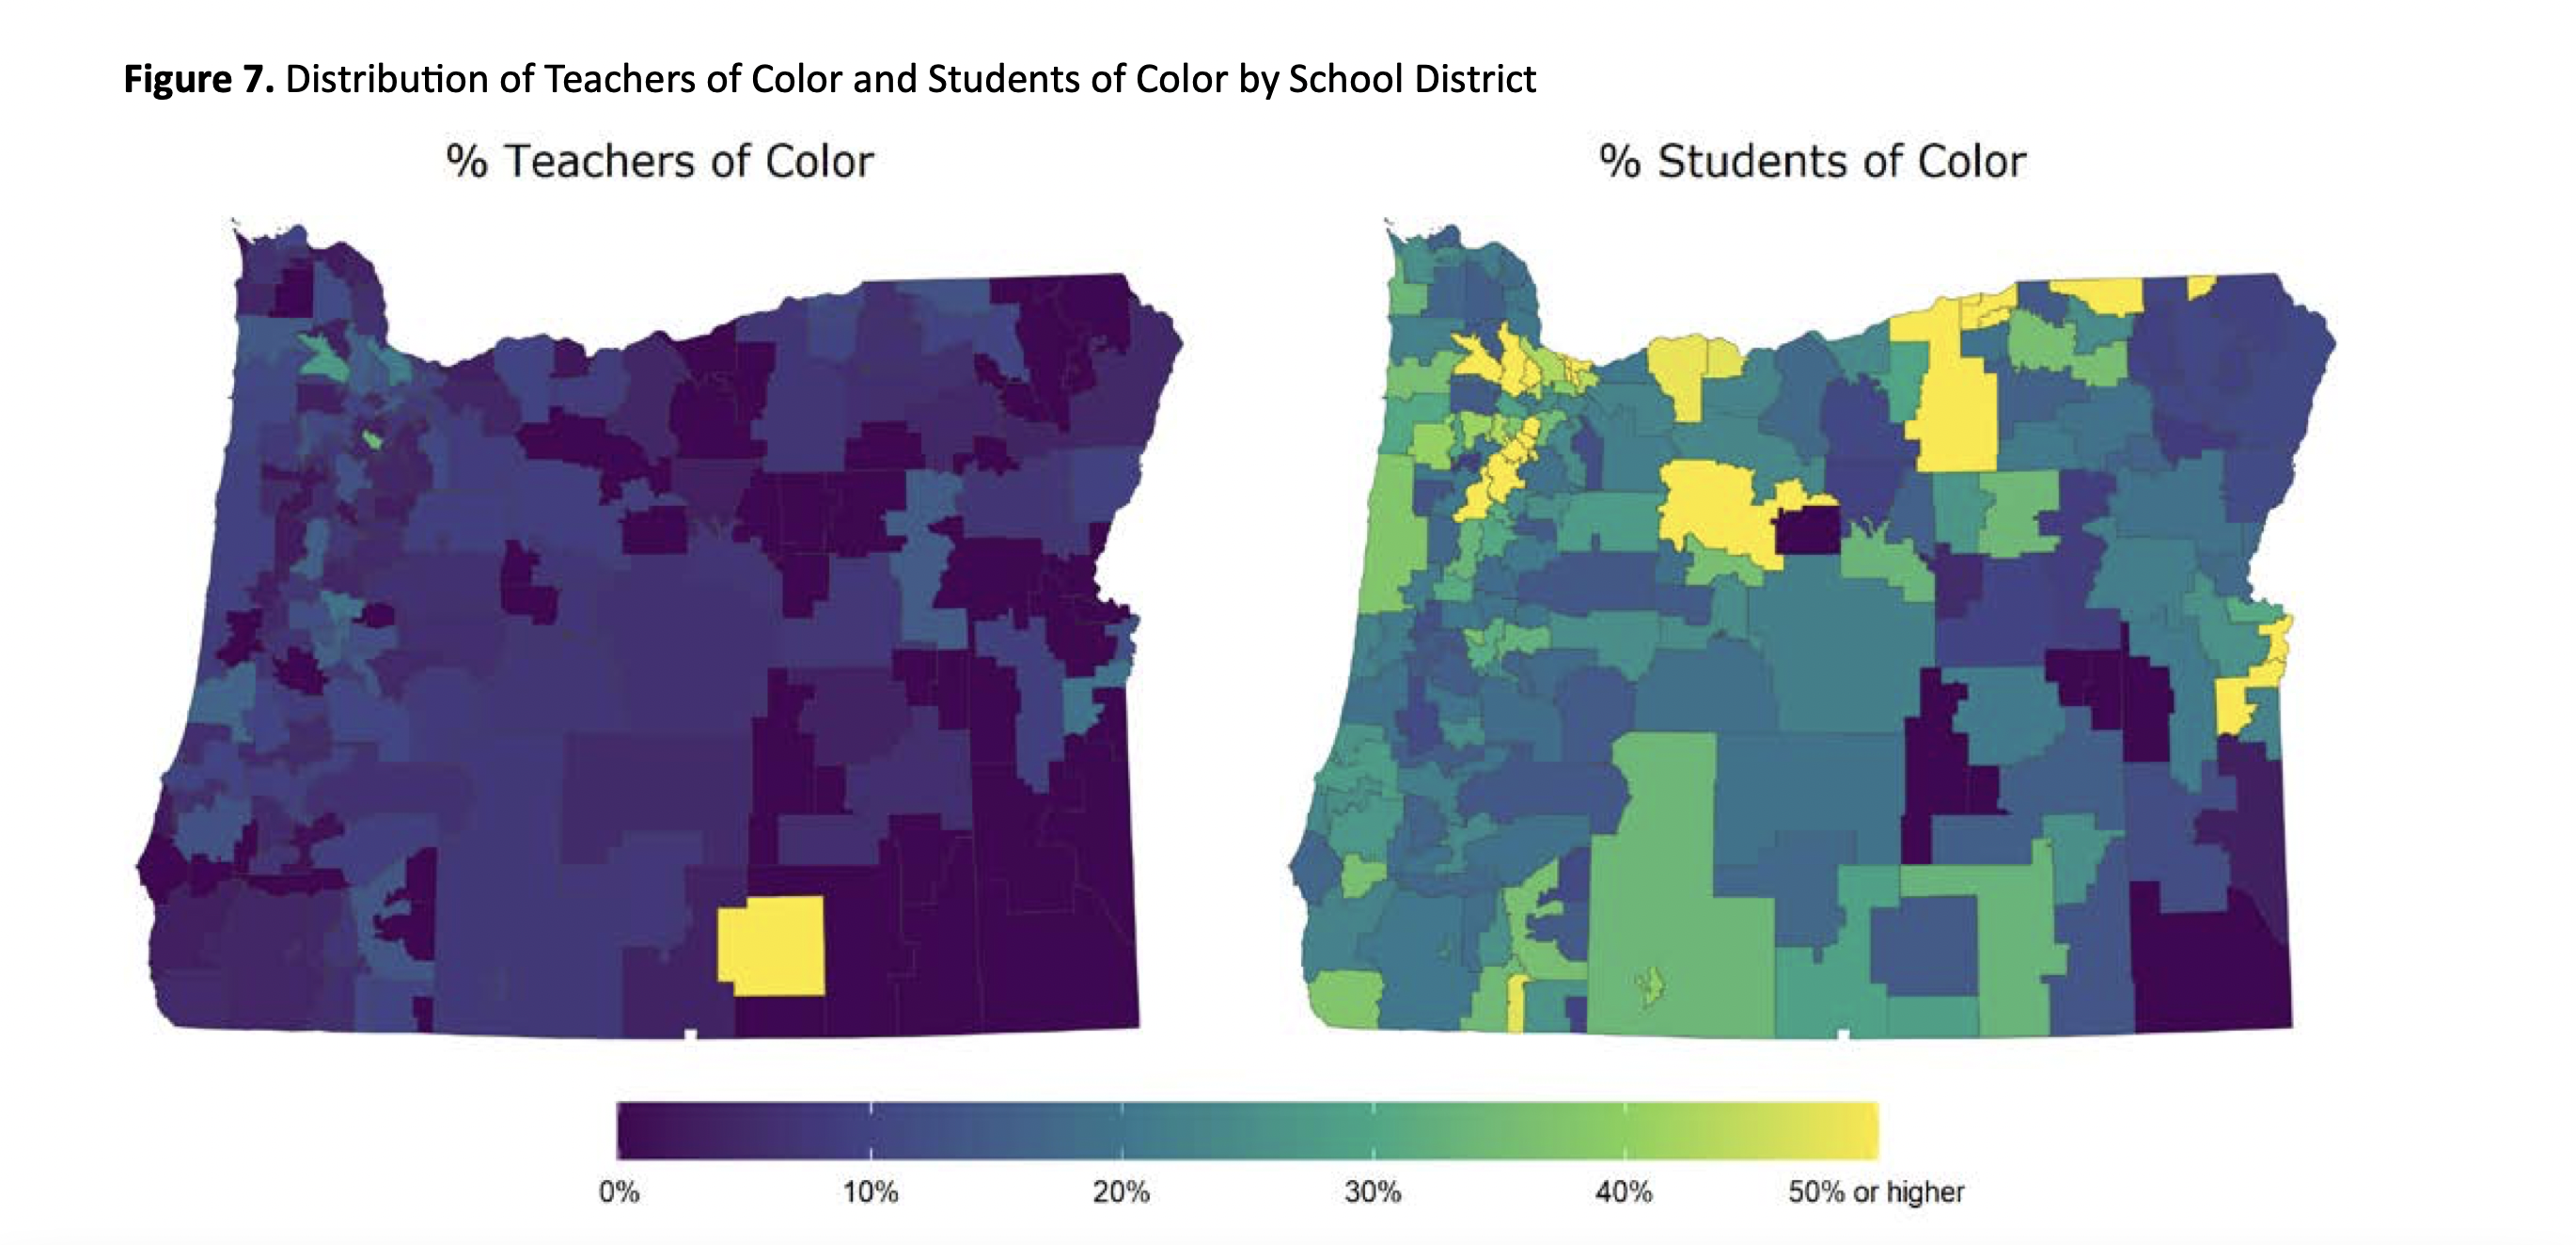
Similarly, this figure shows a geographic representation of the percent of students of color and percent of teachers of color. As mentioned above, the percent of teachers of color is not representative of the student demographics across the state.
- Graduation rates (total, and by demographics) [8]
- Total ACGR (adjusted cohort graduation rate): 80% (5.8% lower than national average)
- Graduation rates by demographics:
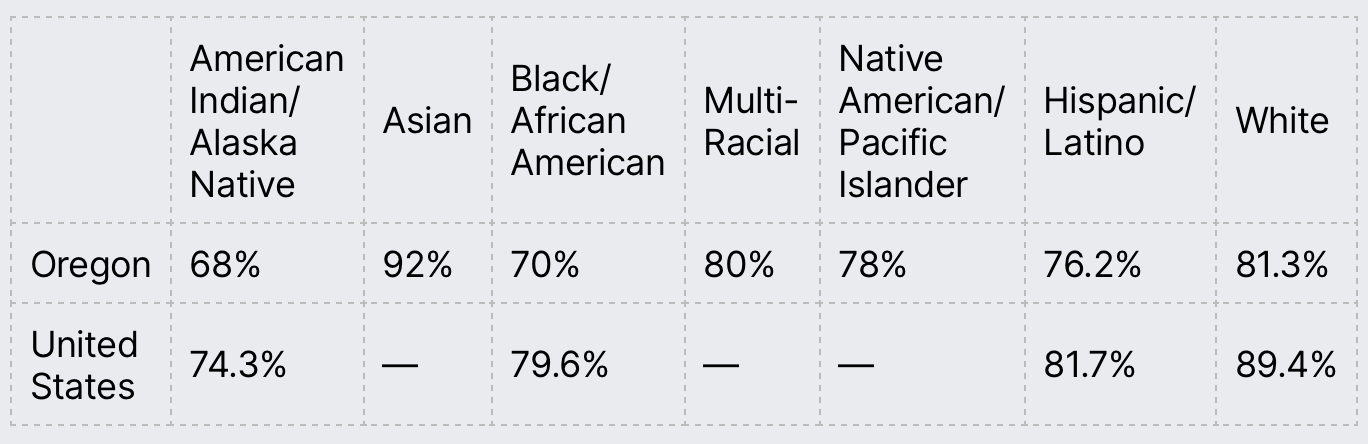
For the data available, all the graduation rates in Oregon are lower than the national average, with the gap being largest for Black and African American students.

Through this data, we are able to see how graduation rates are affected based on different social categories. While the national averages are still low, the graduation rates in Oregon are especially low in these four categories, highlighting the systemic issues and lack of support these students receive.
- Accountability measures (testing, portfolios, growth, etc.) [1]
- Assessments used:
- National Assessment of Educational Progress (NAEP)
- Trends in International and Science Study (TIMSS)
- Statewide Assessments
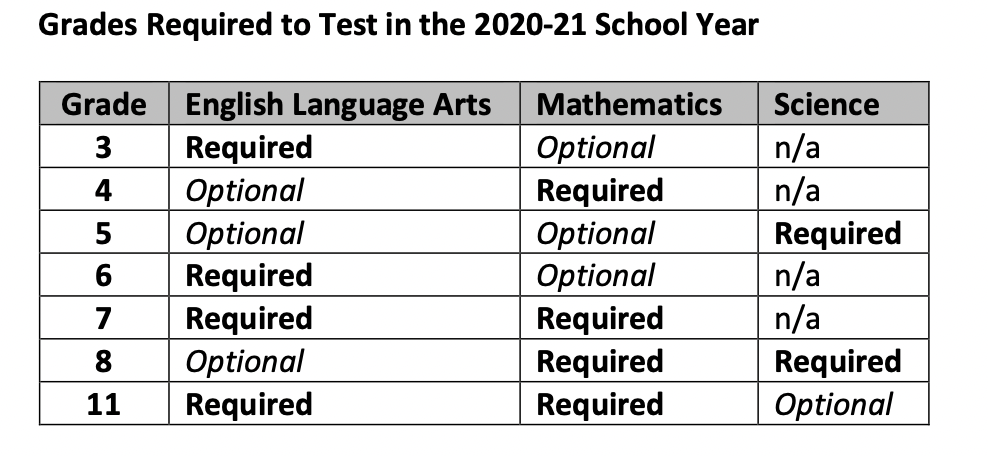
- taken at grades 3, 4, 5, 6, 7, 8, and 11 for English language arts and mathematics
- taken at grades 5, 8, and 11 for science
- based on COVID-19, the number of tests for the 2020-2021 school year were reduced as outlined below:
- Assessments used:
-
- Every Student Succeeds Act (ESSA) Accountability System
- Uses the following measures to identify schools for targeted or comprehensive support:
- regular attenders
- achievements in English Language Arts
- achievement in mathematics
- growth in English Language Arts
- growth in Mathematics
- progress of English learners
- 9th grade on-track
- four-year graduation rates
- five-year completion rates
- Measures of Interim Progress are the specific annual targets for the accountability measures listed above
- Uses the following measures to identify schools for targeted or comprehensive support:
- Every Student Succeeds Act (ESSA) Accountability System
- Subject matter assessed by accountability measures [9]
Percent of Students Classified as “Below Basic” on the following NAEP exams:
| Grade 4 Reading | Grade 4 Mathematics | Grade 8 Reading | Grade 8 Mathematics | |
| Oregon | 36% | 25% | 27% | 33% |
| United States | 35% | 20% | 28% | 32% |
- From this table, we can see the only value that is significantly different for Oregon from the United States is the mathematics exam in the fourth grade.
- However, there are specific student groups on each exam that have statistically significantly different results than the rest of the United States:
-
- Reading Grade 4 (% of students below basic level):
| English learners | Hispanic origin | White (not of hispanic origin) | |
| Oregon | 84% | 52% | 31% |
| United States | 65% | 46% | 24% |
- The percent of Oregon students who are below the basic level is higher than the national average in all three of these categories (English learners, Hispanic origin, and White), with the 19% difference amongst English learners standing out.
-
- Reading Grade 8 (% of students below basic level)
| English Learners | |
| Oregon | 85% |
| United States | 73% |
Similar to grade 4, the performance amongst English learners in Oregon on the reading exam is significantly lower than the national average.
-
- Mathematics Grade 4 (% of students below basic level):

- For the mathematics exam, we again see English learners with the largest percentage difference in Oregon. However, other categories that stand out are Hispanic origin and two or more races.
-
- Mathematics Grade 8 (% of students below basic level):
| English Learners | Hispanic Origin | White | |
| Oregon | 89% | 55% | 25% |
| United States | 73% | 43% | 21% |
Finally, on the mathematics exam in grade 8, we again see English learners with the largest percent of students not meeting the “basic” level, a figure that is consistent across all four of these exams.
- Testing or proficiency graduation requirements
- Before 2019, students had to demonstrate proficiency in the nine essential skills listed below to graduate. This was done through assessments in the individual districts which students were required to pass. However, Senate Bill 744 passed in 2021, suspending the requirement that students need to show proficiency in the essential skills. Testing still takes place but is not needed to graduate, only the 24 academic credits are required. [10]
- The nine Essential Skills that were used: [11]
- read and comprehend a variety of text
- write clearly and accurately
- apply mathematics in a variety of settings
- listen actively and speak clearly and coherently
- think critically and analytically
- use technology to learn, live, and work
- demonstrate civic and community engagement
- demonstrate global literacy
- demonstrate personal management and teamwork skills
- Adoption of Common Core [12]
- Oregon has adopted Common Core Standards since they were created in 2009
- October 28, 2010: adopted the following standards:
-
-
- The Common Core State Standards for English Language Arts & Literacy in History/Social Studies, Science, and Technical Subjects
-
-
-
- The Common Core State Standards for Mathematics
-
- Adoption of Next Generation Science Standards [13]
- Adopted March 6, 2014
- To read more about specific standards for each grade, click HERE
- Number of charter schools and percentage of students served (if applicable) [1]
- 132 charter schools
- Serves 8.25% of students (46,275 students)
- Permissible voucher use: Oregon does not currently have a voucher program. Instead, there is an open enrollment program that allows students to transfer between school districts with permission from the local school board. [14]
- Average teacher salary [15]
- Average public school teacher salary: $67,685
- National average: $64,133
- Teacher to Student Ratio [15]
- Average teacher to student ratio was 1 to 19.4 (2019-2020)
- National average: 1 to 15.6
- Presence of teachers unions/collective bargaining (e.g., AFT/NEA)
- Oregon Education Association [16]
- Union that represents 41,000 educators
- members also belong to National Education Association (NEA) with 3.2 million members
- “OEA members are affiliated with Local Associations, which bargain their work contract with support from OEA staff.”
- Portland Association of Teachers [17]
- represents more than 4,500 teachers in the Portland Public School System
- union bargains with district over everything from workload to wages
- Oregon Education Association [16]
- Merit pay for teachers (in state or district)
- Currently, there is no state-wide initiative for merit pay. In 2008, Measure 60 was rejected by voters which would have based teacher pay on their classroom performance and qualifications rather than seniority. [18]
- Case Study: Oregon City School District [19]
- In 2011, Oregon City School District applied for a federal grant through the Teacher Incentive Fund. The district spent $55,000 of the $2.54 million grant, but ultimately decided to leave the program. The program required they implement a merit pay plan for teachers based on student’s standardized test scores, and since the district did not believe this would benefit student achievement, they left the program and rejected the remaining $2.5 million.
- Teacher evaluation methods and measures [20]
- Teacher evaluations must include the following elements:
- standards of professional practice
- standards that are set to ensure teacher’s effectively prepare students for careers, college, and engaged citizenship
- differentiated performance levels
- rating scale on rubric from 1 to 4
- multiple measures
- measures from the following categories: professional practice, professional responsibilities, and student learning and growth
- evaluation and professional growth cycle
- cycle includes the following elements: self-reflection, goal setting, observation/collection of evidence, formative assessment/evaluation, and summative evaluation
- aligned professional learning
- educators must have opportunities for professional growth to meet their specific needs
- standards of professional practice
- To read more about these five elements for teacher evaluations, click HERE
- Teacher evaluations must include the following elements:
Data Analysis:
In two to three paragraphs, address the following questions:
- Based on the data you’ve collected, why do inequities persist in your state? What evidence did you see of the state addressing or overcoming inequities?
There are many reasons why inequalities exist in education, but for the state of Oregon, two that stand out are school funding and the lack of teachers of color.
School funding tends to be an issue in many states, not just Oregon. The current funding model creates inequality amongst students due to the differing amount of money allocated to each student based on geographic regions. On average, schools in Oregon receive $948 per pupil from the federal government, $7,356 per pupil from state funding, and $5,625 per pupil from local funding. [4] While the federal and state spending is more consistent across the state, the local funding differs immensely based on the geographic region since it is based on local property taxes. The most extreme cases for high and low pupil expenditure, as listed above, are $396 per pupil and $78,891 per pupil. While these cases are at a virtual charter school and a public school that boards due to distance, the funding per pupil is still very different based on the geographic location. [5] Through the data above, we can see that graduation rates differ immensely for students experiencing houselessness. Additionally, on the exams taken at the 4th grade and 8th grade level, there were higher percentages of students who did not meet the basic level in specific categories such as English learners, Hispanic origin, and two or more races. [9] These students who belong to minority groups are not receiving the support and resources they need. Due to the critical role of local property taxes, their schools are more likely to be underfunded. This causes different schools to have different electives, resources, outside support, teachers, and education tools, greatly impacting the quality of education that the student receives.
Another inequality in education in Oregon is the lack of teachers of color that are hired. Research has shown “that when children have teachers of the same race, it can benefit their behavior, academic growth, and motivation.” [21] However, this is currently not the case in Oregon, as the graphs above in the teacher demographics section shows. In fact, “many rural school districts with 40 percent or more racially, ethnically, and/or linguistically diverse students show little to no increase in racially, ethnically, and/or linguistically diverse educators.” [7].
One example of Oregon taking initiatives to address this problem is Senate Bill 13. This specifically addresses curriculum, requiring students in grades 4, 8, and 10 to learn Native American curriculum. While this is meant to address the opportunity gaps between Alaska Native and American Indian students, this also helps retain Alaska Native and American Indian educators who are now more represented in the curriculum. Additionally, in 2017, Senate Bill 182 was passed which enacted the Oregon Teacher Scholars Program. This program was designed to assist incoming educators of color by preventing barriers and providing a support system through networking and mentoring since they are likely to be placed in a school of almost entirely or all white educators. [7] The state of Oregon clearly recognizes this is an issue that needs systemic reform to occur. While they have passed a number of initiatives and are looking to make progress, the percentage of educators of color is still not representative of the population. More educators of color in the state of Oregon need to be hired with networks of support and resources in place.
- Describe and analyze one particular trend or education-specific event in your state
One education event that has occurred in Oregon is the passing of Preschool for All, a ballot measure (Measure 26-214) that will provide free preschool education to all 3 and 4 year-olds in Multnomah County, a county that includes Portland, Oregon. [21]
Early education is said to have numerous benefits for students. This is the time when students learn to interact with others, whether that be their peers or authority figures. During this time, the foundation for their learning is set-up and a holistic approach is taken, focusing on their social, emotional, and physical needs. Students learn things such as language and literacy, thinking, self-control, and self-confidence. In fact, studies have shown that children in early education programs are less likely to repeat a grade, more prepared academically for later grades, more likely to graduate from high school, and more likely to be higher earners in the workforce. [22]
Currently, there are many inequities regarding who has access to preschool as many families are not able to afford it. Additionally, there is the perpetual issue of teachers being underpaid, so this combination prevents many children in the United States from receiving an education before they enter kindergarten.
The new measure for universal preschool is considered one of the most progressive policies in the nation, and depending on its effectiveness in the coming years, could become a model nationwide. The measure provides free preschool for 3 and 4 year-olds “in public schools and in existing and new private preschools and home-based child care centers.” Additionally, teacher pay would be increased greatly. Currently, preschool teachers are paid $31,000 a year, but through the new measure, they will make around $74,000, roughly the same amount as kindergarten teachers. An additionally 2,300 teachers will be hired through this initiative to account for the additional 12,000 preschool spots. To finance this measure, “individuals will pay a 2.3 percent tax on taxable income over $125,000, and households will pay that tax on taxable income over $200,000. The tax will increase to 3.8 percent on individual income over $250,000 and household income over $400,000.”
When implemented, preschool spots will be first given to students with the most need, but the program is not targeted at low-income students and emphasis is placed on the “universal” aspect. That being said, families with “low incomes, families of color, migrant or refugee families, non-English speaking families, military households, students living in foster care, students with teenage parents and students with special needs” will be prioritized first. The implementation of this measure will take place over the next 8 years, reaching full implementation of 11,000-12,000 spots by the year 2030. This fall, there will be 677 spots available, 206 of which will be new and 471 of which were available but unaffordable to low income families. [21]
This measure is really exciting because it shows promise for change in regard to early education. Based on affordability for families and underpaid teachers, early education is not equitable and tends to only serve wealthier families. This measure shows that educators, the community, and legislators have the power to come together and create change to address inequities in our education system.
Footnotes
[1] Oregon Department of Education, Oregon Statewide Report Card, 2020-2021 (Salem, Oregon, November 22, 2021), 3. https://www.oregon.gov/ode/schools-and-districts/reportcards/Documents/rptcard2021.pdf.
[2] Oregon Secretary of State, Shemia Fagan. “Public Education” (web page), accessed May 8, 2022, https://sos.oregon.gov/blue-book/Pages/education-public.aspx.
[3] United States Census Bureau, “Tables: Education, School Enrollment, Oregon”, accessed May 8, 2022, https://data.census.gov/cedsci/table?t=Education%3ASchool%20Enrollment&g=0400000US41&tid=ACSST5Y2020.S1401.
[4] Melanie Hanson, Education Data Initiative, “U.S. Public Education Spending Statistics”, March 15, 2022, https://educationdata.org/public-education-spending-statistics#oregon.
[5] Oregon.gov, “K-12 School Funding Information” (web page), Oregon Department of Education (website), accessed May 8, 2022, https://www.oregon.gov/ode/schools-and-districts/grants/Pages/K-12-School-Funding-Information.aspx.
[6] Oregon.gov, “Accountability Measures” (web page), Oregon Department of Education (website), accessed May 8, 2022, https://www.oregon.gov/ode/schools-and-districts/reportcards/reportcards/Pages/Accountability-Measures.aspx.
[7] Educator Advancement Council, 2020 Oregon Educator Equity Report (November 2020). https://www.oregon.gov/highered/research/Documents/Reports/2020-Educator-Equity-Report.pdf
[8] Institute of Education Sciences, “Table 1. Public high school 4-year adjusted cohort graduation rate (ACGR), by race/ethnicity and selected demographic characteristics for the United States, the 50 states, the District of Columbia, and Puerto Rico: School year 2018–19” (web page), National Center for Education Statistics (website), accessed May 8, 2022, https://nces.ed.gov/ccd/tables/ACGR_RE_and_characteristics_2018-19.asp#f3.
[9] Oregon Department of Education, “National Comparison for Student Achievement”. Accessed May 8, 2022, https://www.oregon.gov/ode/educator-resources/assessment/NAEP/Documents/NAEP-section-of-18-19-SWRC.pdf.
[10] Elizabeth Miller, “A closer look at Oregon’s decision to drop high school graduation ‘essential skill’ requirements”, Oregon Public Broadcasting, 20 September, 2021, https://www.opb.org/article/2021/09/20/examining-oregon-decision-to-drop-high-school-essential-skill-requirements/.
[11] Oregon.gov, “Essential Skills Graduation Requirement” (web page), Oregon Department of Education (website), accessed May 8, 2022, https://www.oregon.gov/ode/educator-resources/essentialskills/Pages/default.aspx
[12] Common Core Standards Oregon, Common Core State Standards for English Language Arts & Literacy in History/Social Studies, Science, and Technical Subjects. https://www.ode.state.or.us/wma/teachlearn/commoncore/oregon-common-core-state-standards.pdf.
[13] Oregon.gov, “Science Standards” (web page), Oregon Department of Education (website), accessed May 8, 2022, https://www.oregon.gov/ode/educator-resources/standards/science/Pages/Science-Standards.aspx.
[14] The Hunt Institute, “School Choice State Summary, Oregon”, Hunt-Kean Leadership Fellows, accessed May 8, 2022, http://www.hunt-institute.org/wp-content/uploads/2015/04/ChoiceSummary_Oregon.pdf.
[15] National Education Association, Ranking of the States 2020 and Estimates of School Statistics 2021 (April 2021), 25. https://www.nea.org/sites/default/files/2021-04/2021%20Rankings_and_Estimates_Report.pdf.
[16] Oregon Education Association, 2022, https://www.oregoned.org.
[17] Portland Association of Teachers, accessed May 8, 2022, https://www.pdxteachers.org.
[18] Ballotpedia, “Oregon Teachers Performance Pay, Measure 60 (2008), accessed May 8, 2022, https://ballotpedia.org/Oregon_Teachers_Performance_Pay,_Measure_60_(2008).
[19] Valerie Strauss, “Why a School District Rejected $2.5 million federal grant”, The Washington Post, October 24, 2011, https://www.washingtonpost.com/blogs/answer-sheet/post/why-a-school-district-rejected-25-million-federal-grant/2011/10/24/gIQAxrytCM_blog.html.
[20] Oregon Department of Education, Oregon Framework for Teacher and Administrator Evaluation and Support Systems (Salem, Oregon, October 2021). https://www.oregon.gov/ode/educator-resources/educator_effectiveness/Documents/oregon-framework–for-eval-and-support-systems.pdf.
[21] Claire Cain Miller, “How an Oregon Measure for Universal Preschool Could Be a National Model,” The New York Times, November 6, 2020, https://www.nytimes.com/2020/11/06/upshot/oregon-universal-preschool-election.html.
[22] University of Massachusetts Global, “What is the purpose of early childhood education? Why it’s so important,” University of Massachusetts Global Blog, 14 July 2021, https://www.umassglobal.edu/news-and-events/blog/what-is-purpose-of-early-childhood-education.