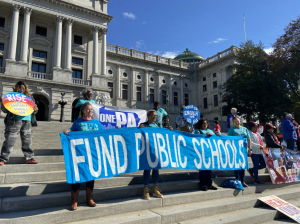
Image 1. Students and educators rallied for Pennsylvania public education on the Capitol steps in November of 2021 (Pennsylvania Capital-Star, 2022).
Nicknamed the “Keystone State,” Pennsylvania plays a central role in American history, from the country’s founding to the present day. Given this foundational importance, it is necessary to take a close look at Pennsylvania’s public education system as a case study for an American education. Thus, this analysis will investigate the demographics, spending patterns, teacher treatment, testing, and current events related to Pennsylvania’s public schools.
By Maya Le
Pennsylvania at a glance

Image 2. Map of Pennsylvania (Nations Online, 2022).
- 24th best public school system in the US (Forbes Magazine, 2020)
- 1,704,396 total public students (Digest of Education Statistics, 2020)
- $33,037,839 spent on total state public education budget (DES, 2018-2019)
Demographics
Pennsylvania ranks 29th in a list of the “Most Diverse States in America,” which takes into consideration many indicators of diversity, such as race, socio-economic status, and religion (Wallethub, 2021). This indicates that Pennsylvania is less diverse than the average state. Looking at the demographics of PA public schools, there is consequently an above average percentage of white students (Fig 1). Other groups are underrepresented, especially Hispanic/Latinx students. Metropolitan areas, including Philadelphia and Pittsburgh, have more diversity than their rural counterparts.
Pennsylvania’s graduation rate is slightly above the national average of 86%. This graduation rate differs significantly by demographics, however, with Asian and white students graduating at rates above the state average, and Hispanic and Black students graduating at lower rates (Fig 2). Students with limited English or disabilities, or students who are experiencing homelessness or foster care also have below average graduation rates. Additionally, just over half of PA students qualify for free/reduced average (about the national average). These statistics points to broader systemic inequities within the state’s public education system. Also, this system is moving more and more towards embracing school choice/vouchers, as an above average percentage of PA public schools are charters.
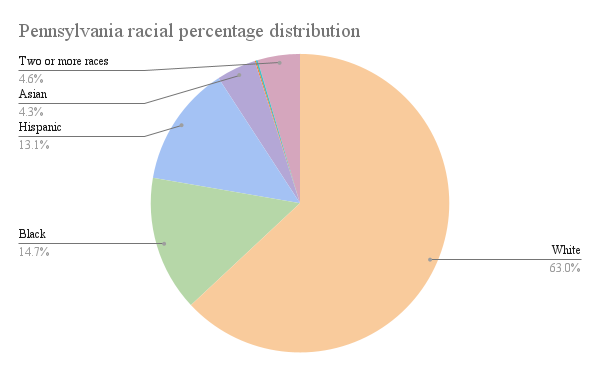
Figure 1. Racial demographics of Pennsylvania public schools (DES, 2020).
| Race | National percentage distribution | Pennsylvania percentage distribution |
| White | 45.8 | 63.1 |
| Black | 15.0 | 14.7 |
| Hispanic | 28.0 | 13.1 |
| Asian | 5.4 | 4.3 |
| Pacific Islander | 0.4 | 0.1 |
| Native American | 0.9 | 0.2 |
| Two or more races | 4.5 | 4.6 |
Table 1. Racial demographics of public schools nationally and in Pennsylvania (DES, 2020). Pennsylvania is more white than the national average.
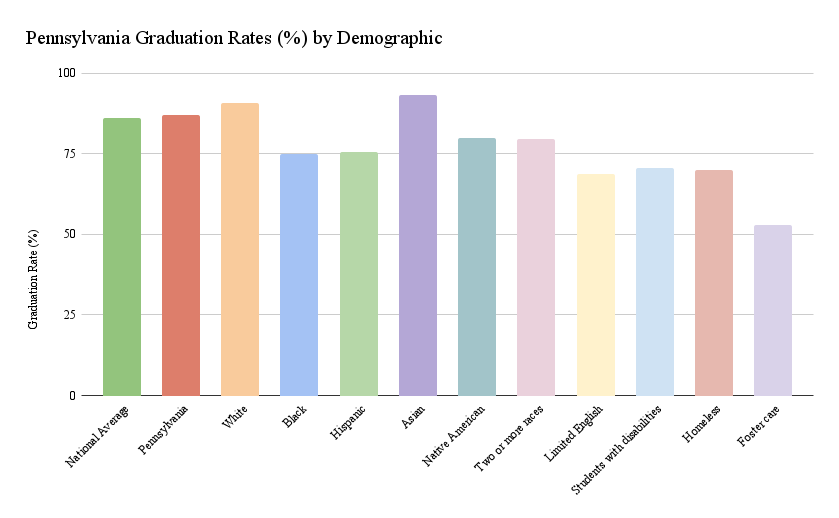
Figure 2. Graduation rates for Pennsylvania demographics as compared to the national average (NCES, 2018-2019). Pennsylvania’s overall graduation rate is slightly higher than the national average. The state average varies significantly based on race and identity/experience.
- 50.28% of students are eligible for free/reduced-price lunch, approximately matching the national average (DES, 2020)
- 180 charter schools, serving 143,201 students or 8.4% of total PA public school enrollment (DES, 2018-2019)
Spending and Budgets
While Pennsylvania spends a significant and above average amount on public education (both in total and per pupil), the state also has stark inequities within funding. For example, the difference between the per pupil expenditure in the highest district and the lowest district is $21,662. Additionally, Philadelphia made the Top 10 list of school districts with the largest total funding gaps. Overall, the data reflect that, although the broader statistics make Pennsylvania appear well-funded, there exist notable inequalities in such funding.
- Total state public education budget: $33,037,839 (DES, 2018-2019)
- Pennsylvania students receive the second largest amount of federal aid per capita (Stacker, 2019)
- Average per pupil expenditure: $16,377 in PA vs. $12,654 nationally (DES, 2017-2018)
- High/low per pupil expenditure within state: $11,115 Waynesboro vs $32,777 Wilkinson (DES, 2018-2019)
| Districts with Largest Aggregate Funding Gaps | |||||
| District Name | State | Funding Gap (Total) | % in Poverty | % Latinx | % Black |
| Los Angeles Unified | California | $5.77 Billion | 33 | 74 | 8 |
| Clark County School District | Nevada | $2.62 Billion | 25 | 46 | 14 |
| Houston ISD | Texas | $2.61 Billion | 33 | 62 | 24 |
| City of Chicago SD 299 | Illinois | $2.36 Billion | 34 | 47 | 38 |
| Dade | Florida | $2.24 Billion | 25 | 70 | 21 |
| Dallas ISD | Texas | $2.17 Billion | 35 | 70 | 23 |
| Philadelphia City SD | Pennsylvania | $1.40 Billion | 40 | 20 | 51 |
Table 2. Aggregate funding gaps by district (The Century Foundation, 2020). Philadelphia has the 7th largest total funding gap.
Teachers
Pennsylvania’s base teacher salaries are higher than the national average for both educators with a bachelor’s degree and a master’s degree. Merit pay adds to this salary, especially after the major grant from the Gates foundation, though merit pay has been criticized for overemphasizing teacher evaluations and student testing.
The Pennsylvania State Education Association is one of the largest teachers’ unions in the country, and thus holds a lot of power. It is also one of the oldest teachers’ unions, founded in 1852. Their mission is to advocate for teachers (like Elizabeth Raff below), students, and schools. The PSEA played a role in supporting Act 13, which augmented the role of observation rather than testing in constructing teacher evaluations.

Image 3. The Pennsylvania State Education Association (PSEA) logo (PSEA, 2022).
- Pennsylvania teacher base salary: $57,080 for bachelor’s vs. national: $49,890 and $68,830 for master’s vs. national: $63,120 (DES, 2017-2018)
- Merit pay for teachers available
- Example: Pittsburgh’s merit-based teacher contract is linked to teacher evaluations, made possible with a grant from the Gates foundation of $575 million (Chalkbeat, 2018)
- Presence of teachers unions/collective bargaining: Pennsylvania State Education Association (PSEA) is teachers’ union affiliated with the NEA and has over 178,000 members (PSEA, 2022)
- Elizabeth Raff was named PA Teacher of the Year for 2022
- Raff is a sixth-grade teacher at Pequea Elementary. She is known for her playful Alice in Wonderland decorations, incorporation of physical exercises, and love of creative assignments (Penn Manor School District, 2021)!
 Image 4. Students celebrate Elizabeth Raff’s nomination for PA 2022 Teacher of the Year (Lancaster Online, 2022).
- Raff is a sixth-grade teacher at Pequea Elementary. She is known for her playful Alice in Wonderland decorations, incorporation of physical exercises, and love of creative assignments (Penn Manor School District, 2021)!
- Pennsylvania Act 13 established strict guidelines on teacher evaluations in 2020 (Fox Rothschild, 2020)
- 70% comprehensive classroom observation score shall be calculated as follows:
- 20% planning and preparation
30% classroom environment
30% instruction
20% professional responsibilities
- 20% planning and preparation
- “30% shall be calculated using one or more measures selected by the employer from the following list: (1) locally developed district rubrics; (2) District-designated measures and examinations; (3) nationally recognized standardized tests; (4) industry certification examinations; (5) student projects pursuant to local requirements; and (6) student portfolios pursuant to local requirements.”
- 70% comprehensive classroom observation score shall be calculated as follows:
Testing

Image 5. Children in Pennsylvania spend a significant proportion of class time taking tests (Very Well Family, 2021).
Some of the main tests that Pennsylvania students take are the Pennsylvania System of School Assessment (grades 3-8) and the Keystone Exams (grades 8+). Students also take the National Assessment of Educational Progress. On this test, PA students perform better than the national average for both math and reading, in grades 4 and 8. In 2019, 47% of PA students were at the proficient level (Nation’s Report Card, 2019). Despite this proficiency, barriers exist for certain groups, with students who were eligible for the National School Lunch Program, Black students, and Hispanic/Latinx students all scoring ~30 points lower than the average. The PSEA has long argued that the PA system overemphasizes standardized testing and loses valuable learning time preparing and taking these tests. In response, Governor Wolf has reduced the length of the PSSA by 20% and shifted it later in the year to reduce stress and add learning time (PSEA, 2022).
- Multitude of assessment options: Pennsylvania System of School Assessment (PSSA), the Pennsylvania Alternate System of Assessment (PASA), the Pennsylvania Accountability System (PAS), the Pennsylvania Value-Added Assessment System (PVAAS), the Keystone Exams (end-of-course), Classroom Diagnostic Tools (CDT) and the National Assessment of Educational Progress (NAEP)
- Subject matter assessed by accountability measures:
Grades 3-8: Math and Reading. Grades 8+ add Science
- Subject matter assessed by accountability measures:
| Subject | National | Pennsylvania |
| Math | 240 | 244 |
| Reading | 219 | 223 |
Table 3. NAEP Grade 4 scores in math and reading (Nation’s Report Card, 2019). Pennsylvania scores are higher than the national average in both reading and math.
| Subject | National | Pennsylvania |
| Math | 281 | 285 |
| Reading | 262 | 264 |
Table 4. NAEP Grade 8 scores in math and reading (Nation’s Report Card, 2019). PA Grade 8 scores match Grade 4 scores, with higher than average math and reading scores. The Grade 8 math score, however, is not as high compared to the national average as it was in Grade 4.
Current Events
Philadelphia Privatization
- Philadelphia is listed as the US metropolitan area with the 5th highest K-12 private school enrollment. Many of these private schools are religiously affiliated, especially due to Philadelphia’s high Catholic, Amish, Quaker, and Jewish populations (Trulia, 2022).
- The documentary Backpack Full of Cash (click here for the trailer) similarly highlights Philadelphia as a key district of growing school privatization/charters/school choice support, exploring the impact of these movements on Philly youth.
 Image 6. The poster for Backpack Full of Cash, a documentary on threats to America’s public school system (Backpack Full of Cash, 2016).
race and “critical race theory”
- Pennsylvania provides insights into the vast racial disparities that exist within education. For example, the state has one of the widest gaps between the racial demographics of students vs. teachers: in Philadelphia, 40% of students are Black, compared to 14% of the teachers. Additionally, in Allentown, 70% of students are Latinx, but only 3% of their teachers are. And studies show that the Pennsylvania teaching force is growing more white (Philadelphia Chalkbeat, 2018).
- As a swing state, Pennsylvania houses significant political diversity. One contested topic that has flooded the public education sector is “Critical Race Theory,” an academic theory about how race intersects with US institutions and policies. Pennsylvania public schools don’t teach CRT (which is a graduate-level theory) but critics argue that the curriculum is “brainwashing” students about race. Pennsylvania is one of 22 states that introduced legislature to ban teaching CRT in classrooms and Mars Area School district in western PA was the first district to actively ban it (Pennsylvania Capital Star, 2021).
- These two issues highlight how polarized public education has become, with opposing political groups fighting for and against discussions of racial inequities within the state.
COURT CASE: SCHOOL FUNDING
- In March of this year, a case went to the Commonwealth of Pennsylvania arguing that Pennsylvania public schools have been systematically underfunded. Plaintiffs defended this argument with research that 86% of Pennsylvania students attend schools that do not receive adequate resources for education, violating the state law. Additionally, many public schools lack nurses, counselors, librarians, and art teachers. This case relates to the data on funding inequities highlighted above. A resolution with procedural steps is expected to come during this summer (The Hechinger Report, 2022).
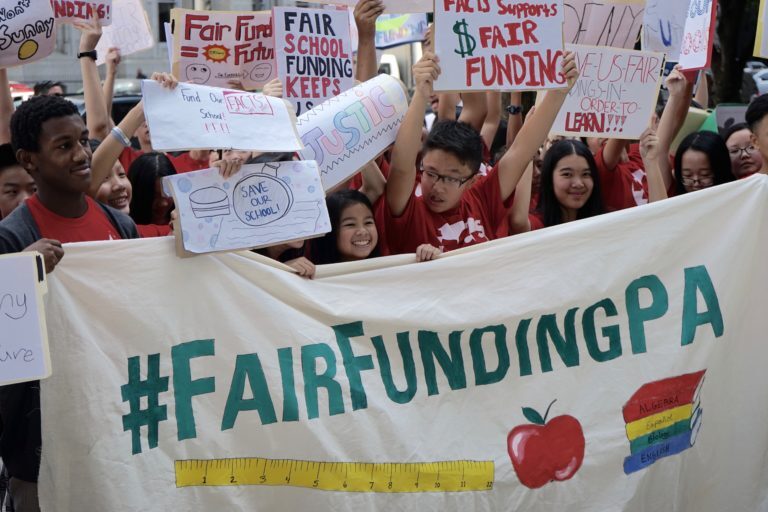 Image 7. Children protest for fair funding in education outside Philadelphia City Hall (WHYY, 2020).
Bibliography
Click here for the bibliography.