According to U.S. News, Rhode Island is ranked 25 in the country for K-12 education. Let’s see why:
Jessica Klein
Data:
- Total public school student population {1}
- 139,184
- Total state public education budget {2}
- $2.3 billion annually

Over half of Rhode Island's schools are funding
 locally. Federal funding only accounts for 7%.
School Attendance
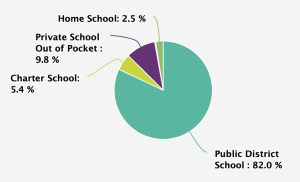
The majority of Rhode Island students attend a
public district school. However, private school attendance is almost 10%, and charter school
students account for about 1/20 of all students.
- Average per pupil expenditure {3}
- 13.34 pupil/teacher ratio
- $18,383 per pupil expenditure
- High/low per pupil expenditure {3}
- High – $39,923 New Shoreham
- Low – $14,939 Blackstone Valley
- Average national per pupil expenditure {4}
- $12,264 per pupil
- Student demographics {5}
- 10.7% LEP (limited english proficiency)
- 46.84% free or reduced lunch
- 16.1% individualized educational plan (special education and related services)
Student Racial/Ethnic Background {1}
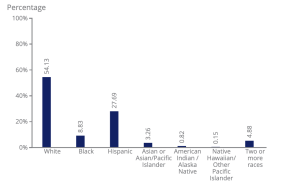
The majority of Rhode Island students are White
and around a quarter of students are Hispanic.
- Graduation Rate
4-Year Rates for Graduating {6}
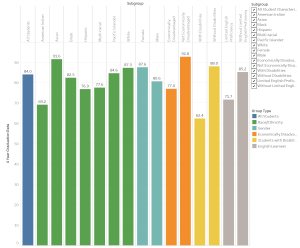
The highest graduation rate was among students who are not economically disadvantaged, and the lowest
 rate was students with disabilities.
- Of graduates:
- 8.01% LEP (limited english proficiency)
- 36.4% free or reduced lunch
- 11.9% individualized educational plan (special education and related services)
Analysis:
Rhode Island is neither at the top or bottom of state rankings for education {10}. In many cases and for many statistics, Rhode Island is close to or at the national average for student achievement. For instance, 8th graders performed at or below the national average when assessed in math, reading, writing and science {1}. The average per pupil expenditure for the state is $18,383, which is over $6 higher than the national average of $12,264 per pupil {3,4}. The discrepancy can be explained through the difference of the high and low per pupil expenditure within Rhode Island. The lowest expenditure is close to consistent with the national average of $14,939 per pupil. In comparison, the high is $39,923 per pupil, almost three times the lowest expenditure {3}. The large difference between the two values illustrates the unequal education students receive from the same state. With only 7% of the total budget for the districts coming from the federal government, local funding makes up around 52% of the budget. The wealthier areas of Rhode Island are willing and able to pay significantly higher taxes to improve the quality of education for their children. These schools can afford stronger teachers, facilities, and extracurricular activities. Providing more funding per pupil can determine the outcome of these students, as the graduation rate was highest among students who are not economically disadvantaged, 92.8%. There is a direct relationship between the amount of funding per student and their likelihood of graduating.
Accountability
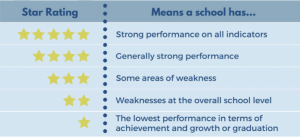
Rhode Island assigns a star rating (ranging from 0-5) to their public schools based a variety of measures for both teachers and studentsthat correspond to a sum number of points. Tests that are performed include RICAS and SAT to assess the school performance. This is documented on the state’s Report Card, and the star rating is a new addition to the accountability system.
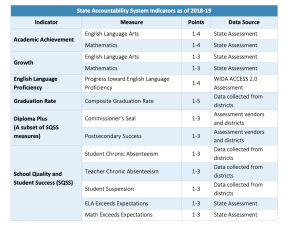
Measures: {5}
- English language proficiency
- Student/teacher absenteeism
- Suspension rate
- Number of students who exceed expectations
- Graduation rates
Goals of the system:
- To lessen the achievement gap
- Use top-rank schools as models for progress so others can learn and implement those practices
- Obtain data and information to further investigate problems
- Recognize schools that would benefit from extra support
Subject matter assessed by accountability measures:
- Math
- Science
- Reading
- Writing
Consequences for failing to meet standards {5}:
- Schools that don’t meet the standards are categorized as “Comprehensive Schools” that are 1 star schools
- A Community Advisory Board must be formed to address School Redesign if the school is a Comprehensive School for 4 consecutive years
- The aim of the board is to allow parents and community members to voice their opinions and listen in to the meetings for School Redesign
- There are five options that the board can choose: Empowerment, Small Schools of Choice, Restart, Closure, or LEA Proposed Redesign Model
- They receive additional support and oversight from the state (access to School Improvement Grant funds, resources, tools, and evidence-based strategies for improvement)
- A Community Advisory Board must be formed to address School Redesign if the school is a Comprehensive School for 4 consecutive years
Testing or proficiency graduation requirements {5}
- Designed to prepare students to enter the workforce or attend post-secondary academics, they must obtain 20 course credits including:
-
- 4 ELA
- 4 Mathematics
- 3 Science
- 3 Social Studies
- 6 Other (Physical Education, Health, Art, Technology, and Language)
- Students must also be evaluated and identified as proficient in ELA, math, science, social studies, the Arts and technology
- Students must fulfill a performance-based assessment (Graduation Portfolio, Student Exhibition, or Senior Project)
-
Analysis:
Schools in Rhode Island that are labeled “Comprehensive Schools” because they did not meet the criteria for measures in Academic Achievement, English Language Proficiency, Growth indicators, and Graduation Rate {5}. While the Rhode Island Department of Education reveals the process they take to support and aid schools that are underperforming, it is after a long delay. Comprehensive Schools must stay in the category for 4 consecutive years to be identified by the government. Then, they will be provided additional support. At this point, schools might have drastically seen the impacts of continually running without the aid of the Rhode Island government. Additionally, multiple criteria must be met to obtain extra funding and help. The state outlines these measures to precisely determine which schools need support, but the criteria can do more harm than good.
Teaching
- Charter Schools {5}
- 35 Charter Schools
- 5.4% of students
- 3 types of charter schools (district charter schools, independent charter schools, and mayoral academies)
- Held to the same accountability measures as public schools
- Average teacher salary {7}
- $66,758 (10th in the country)
- Typically ranges between $39,500 and $97,620
- 10,749 full time teachers
- 38.6% elementary school
- 15.7% middle school
- 45.6% high school
- $66,758 (10th in the country)
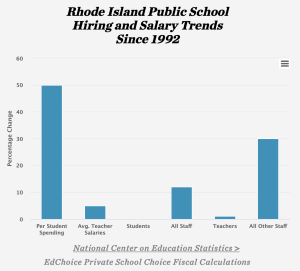
Per pupil spending has changed within the past few years. However, teacher's salary has not changed
significantly. The data is comparing current statistics with its 1992 counterpart.
- Teachers unions {8}
- Rhode Island Federation of Teachers and Health Professionals (RIFTHP) is the state’s labor union. Not only teachers, but also district workers and other employees can be represented by the federation. The RIFTHP is affiliated with one of the two main teacher’s unions, the American Federation of Teachers (AFT).
- Merit pay for teachers {5}
- Rhode Island Department of Education (RIDE), has a Strategic Plan dedicated to assessing teacher and leader performance to decide performance-based compensation.
- Through Race to the Top, two school districts were chosen and awarded based on their schools models. These were evaluated to decide whether they should be implemented in the other districts.
- Teacher evaluation methods and measures {5}
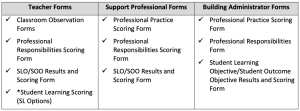
The list for the forms required for educator evaluation.
-
- Three conferences between the teacher and the evaluator
- Three or more classroom observations (one announced and two unannounced) that last at least 20 minutes each. They are graded using the Teacher Professional Practice Rubric
- Feedback is provided after the observations
- Scores and rational are provided after the observations, which are calculated using a points-based system:
- Professional Practice: Classroom Environment (25 percent)
- Professional Practice: Instruction (25 percent)
- Professional Responsibilities (20 percent)
- Student Learning (30 percent)
Analysis:
A prospective teacher in Rhode Island needs to obtain a bachelor’s degree and complete the state’s teacher preparation program {11}. These requirements are common among other states. During the teacher panel, one of the teachers highlighted the impact certification requirements have on teacher shortages. In Rhode Island, more than eight districts have reported shortages in educators. This number continues to grow due to the pandemic {12}. Through frequent discussions about past influential teachers, students report that one of the most crucial qualities is their passion and love for teaching. The restrictions placed on becoming a certified educator makes it more difficult for prospective teachers to join the field. While older students need teachers who are arguably more qualified, it differs depending on the age of the students.
Overall, Rhode Island is ranked the best state for a public school teacher to work, according to USA Today {10}. Teacher quality is also highly rated, and teacher evaluations are relatively relaxed {5}. Additionally, teachers have a favorable teacher to student ratio in the classroom. However, the state lacks policies that issue merit-based compensation for educators to teach in low-income and underperforming districts {10}. While improvements can always be made to provide better working conditions to educators, Rhode Island treats their teachers relatively well. Creating a healthy environment for educators is one of the best and most influential ways to provide a strong education for students.
COVID-19 Impact
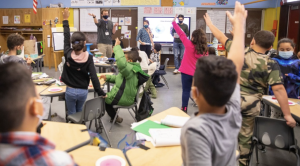
Between 40-50% of Ms. Cox's students are present
in class. She works overtime to accommodate students who are unable to show up. For example, quizzes and lessons have to be available and retaught
multiple times {9}.
- ELA and mathematics were both highly impacted, with mathematics very severe
- Academically, almost every student was negatively impacted
Students who experienced the greatest adverse impact were {5}:
- Hispanic students
- Economically disadvantaged (in math)
- Females (in ELA)
- Older students
“Let it Out”

At the end of March of this year, the Rhode Island Department of Education launched a new campaign titled “Let it Out” {14}. This announcement showcased Governor Dan McKee’s emphasis on addressing mental health needs in the education system. The state has seen an increase in student mental issues, with a large rise during the COVID pandemic {15}. A website has been created, www.letitoutri.com, to provide toolkits for educators, connect students with trusted community members, and supply additional resources. The website also outlines Project AWARE, a program created in 2018 centered around increasing awareness for mental health and the stigmas associated with it, training responsible adults to provide support to those struggling , and connecting students to their families. The accomplishments made by AWARE over the past few years include 13 district policies, training over 4000 individuals, and over 6000 students screened for referrals to mental health services {13}. These successes have convinced the Rhode Island government that mental health is a prevalent problem impacting young students, which influenced more initiatives to be passed including “Let it Out”. The pandemic has raised the previous number (19%) of students ages 6-17 that have a diagnosable mental health condition {14}. Governor Dan McKee has stressed the importance of this initiative as a crucial opportunity to provide the necessary services and support for students who have been impacted by current events.
The findings from the RIDE report using pre-pandemic scores as a baseline highlight the work that the state has to do to catch up and recover from the impact of COVID-19 on the students. Not only are young students behind in ELA and especially in mathematics but minoritized groups were equally impacted as well. Rhode Island’s state government acknowledges that while educators and schools need to focus on academics, some of the most critical impacts on the students might be on their mental health. Lt. Governor Sabina Matos recently emphasized that 50 to 80% of students who don’t have access to mental health services would benefit from them {14}. Increased funding intentionally allocated towards specific programs and resources has proven to be successful. For example, In Union City, New Jersey, there is a day care clinic, medical support clinic, and many other resources. When you take care of outside factors such as family life, transportation students can focus on their education. Funding, if used correctly, can make huge differences in the quality of education and narrow the achievement gap.
Work Cited
{1} NAEP state profiles. (n.d.). Retrieved May 10, 2022, from https://www.nationsreportcard.gov/profiles/stateprofile/overview/RI?cti=PgTab_Demographics&chort=2&sub=MAT&sj=RI&fs=Grade&st=MN&year=2019R3&sg=Gender%3A%2BMale%2Bvs.%2BFemale&sgv=Difference&ts=Single%2BYear&tss=2019R3&sfj=NP
{2} Funding & Finance. (n.d.). Retrieved May 10, 2022, from https://www.ride.ri.gov/fundingfinance/overview.aspx
{3} Necessity of school construction information and instructions – ride.ri.gov. (n.d.). Retrieved May 10, 2022, from https://www.ride.ri.gov/Portals/0/Uploads/Documents/Funding-and-Finance-Wise-Investments/SchoolBuildingAuthority/Necessity-Stage-I-II-Full-Guidance-FY22.pdf?ver=2021-07-30-101649-293
{4} Hanson, M., & Checked, F. (2022, March 21). U.S. public education spending statistics [2022]: Per pupil + total. Retrieved May 10, 2022, from https://educationdata.org/public-education-spending-statistics
{5} Report. (n.d.). Retrieved May 10, 2022, from https://www.eride.ri.gov/reports/reports.asp
{6} Rhode Island Graduation Rates. (n.d.). Retrieved May 10, 2022, from https://tableau.ride.ri.gov/t/Public/views/GRADRATES/GraduationStory?%3Aembed=y&%3Aiid=1&%3AisGuestRedirectFromVizportal=y
{7} Cullinane, A. (2019, November 06). How Rhode Island teacher salaries compare and who’s making six figures. Retrieved May 10, 2022, from https://turnto10.com/i-team/schools-in-crisis/how-rhode-island-teacher-salaries-compare-and-whos-making-six-figures
{8} Rhode Island Teachers and Education News. (n.d.). Retrieved May 10, 2022, from https://www.rifthp.org/
{9} Kimball, J. (2022, May 09). Rhode Island Educators, students, parents gather to discuss pandemic’s impact on K-12 schools. (2022, May 09). Retrieved May 10, 2022, from https://www.brown.edu/news/2022-01-19/schools
{10} Frohlich, T., & Byrnes, H. (2019, July 09). Here’s where it’s best (and worst) to be a teacher. Retrieved May 12, 2022, from https://www.usatoday.com/story/money/2019/07/09/the-states-where-its-best-and-worst-to-be-a-teacher/39647529/
{11} The Rhode Island Teaching and Certification Resource. (2022, February 15). Retrieved May 12, 2022, from https://www.teachercertificationdegrees.com/certification/rhode-island/
{12} Tamara Sacharczyk, N. (2022, February 24). NBC 10 I-team: School Administrators stepping into RI classrooms due to teacher shortage. Retrieved May 12, 2022, from https://turnto10.com/news/crisis-in-the-classroom/school-administrators-stepping-into-classrooms-due-to-teacher-shortage-rhode-island-east-providence-cranston-warwick-chariho-exeter-west-greenwich-students-subsitutes-recruitment
{13} Let it out resources. (n.d.). Retrieved May 12, 2022, from https://www.letitoutri.com/
{14} Inside ride. (n.d.). Retrieved May 12, 2022, from https://www.ride.ri.gov/InsideRIDE/AdditionalInformation/News/ViewArticle/tabid/408/ArticleId/776/Governor-McKee-Rhode-Island-Department-of-Education-Launch-Let-It-Out-Mental-Health-Awareness-Campai.aspx
{15} DaSilva, M., & Fish, K. (2022, April 28). Report: Could take 3-5 years for RI students to recover from covid-19 effects. Retrieved May 12, 2022, from https://www.wpri.com/health/coronavirus/report-could-take-3-5-years-for-ri-students-to-recover-from-covid-19-effects/