Tennessee
By: Bereket Abebe

Tennessee is home to many systematic issues within its public education system. However, I will be focusing on wealth as it pertains to the budget per pupil and districts. I hope to show you through data that there are huge disparities in resources among students from different districts. Districts receive the same amount of funding relatively but most districts rely upon property taxes to achieve more funding. However, in some areas, there are blatant differences in the cost of properties. These translate to the resources available to students. If families do not have the means to fully support a student’s venture in education, whether that be to buy books for classes or test prep material, these students rely on the school. If the school doesn’t provide these resources the student has to scavenge for them.
Tennessee is home to over 900,000 students citywide, in suburbs, and rurally. Tennessee is known to have a huge private school presence with some of the most expensive schools existing in wealthy counties. Nationally, Tennessee ranks 33rd in the best states for education. In this case study, I plan to take a deep dive into a statistical analysis of Tennessee’s public educational system in correlation to budgeting and Natural. Across the US, Tennessee ranks 16th in most equitable schools. Equity tends to be an emphasis on how budgeting is distributed with districts in wealthier areas having more money than a district with more people of color.
At a glance: Basic Educational facts
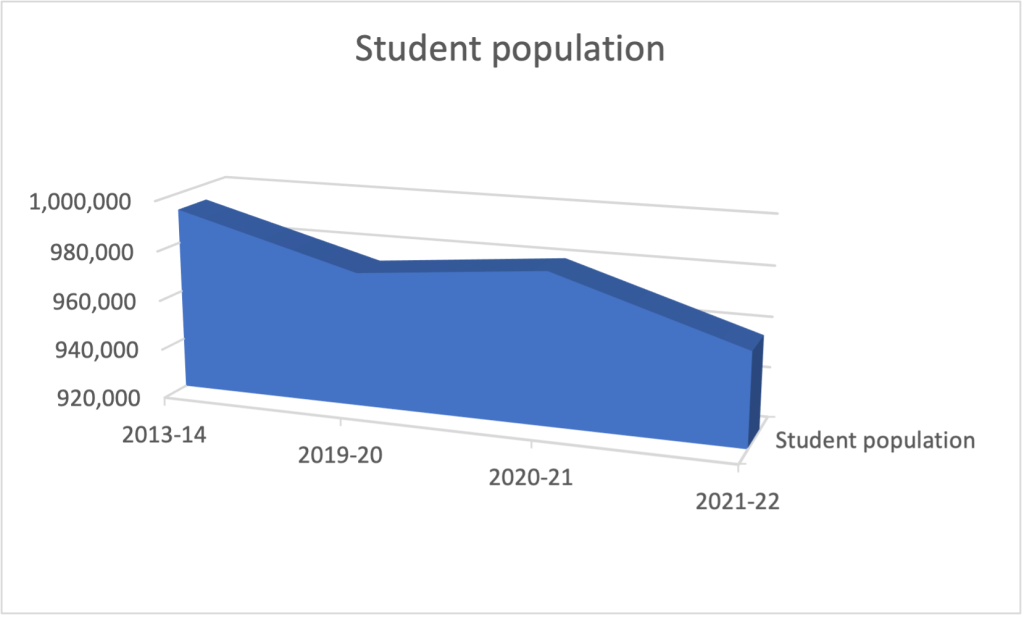
Through this line graph, we can come to understand how the TN student population has fluctuated across the years. We can see a steep increase in the school year 2013-14 but then a steady decline. Merging in past histories and relevance into these numbers we start to maybe understand why through COVID-19. With the pandemic, many students were forced into lifestyles or households that are not conducive to educational growth. With this, we can start to ask questions, in a more focused way through the preceding graphs interns of student demographics and racial breakdown amongst counties.

| School Year | Student population |
| 2013-14 | 993,496 |
| 2019-20 | 973,659 |
| 2020-21 | 980,619 |
| 2021-22 | 957,243 |
Through a more focused sense, we can see the extent to which the drop-off of students between the years 2013-14 is. Comparing the 2013 school year to the 2021 school year there is over a 30,000 difference in students. Keeping diving more we can see how these numbers coincide by area.

Amongst the most prominent counties, Shelby leads in the number of students it holds. With Davidson County being right behind and Knoxville, Rutherford, Hamilton farther away.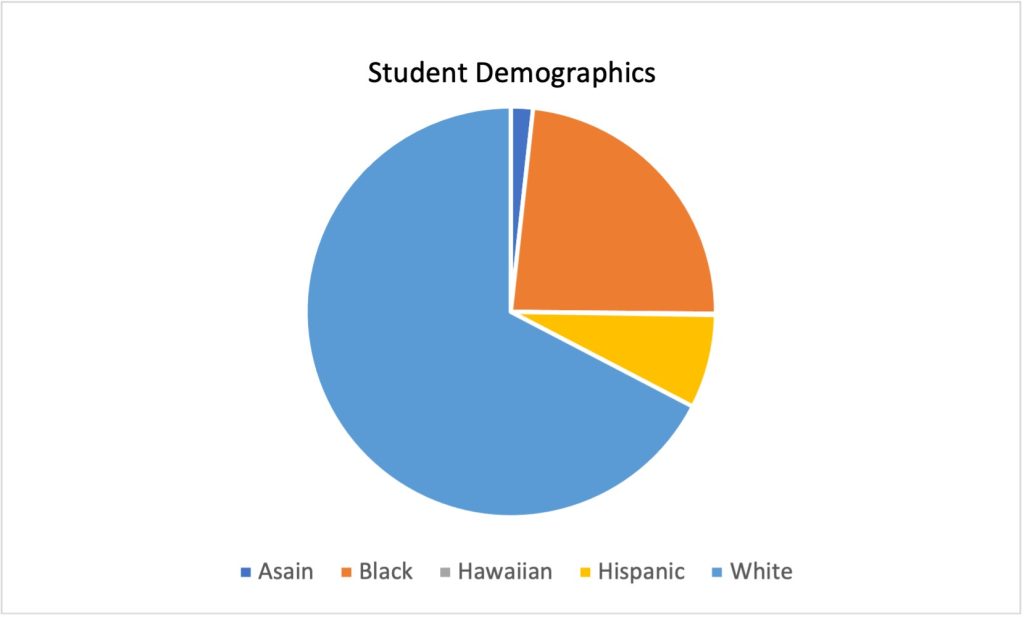
Holistically, white students make up most of Tennessee’s student population in k-12. Minorities make up a little over 25 percent which is astounding given data on the most populated (in terms of students) counties.
| Student demographics(2013) | |
| Asain | 17,024 |
| Black | 228,812 |
| Hawaiian | 992 |
| Hispanic | 72,204 |
| White | 658,568 |
We can see this through a more focused lens with the demographic numbers. The white student population is almost 3x the number of Black students.
| Racial Demographics, 2018-2019 | ||
|---|---|---|
| Race | Shelby County Schools (%) | Tennessee K-12 students (%) |
| American Indian/Alaska Native | N/A | 0.2 |
| Asian or Asian/Pacific Islander | N/A | 2.0 |
| Black | 74.9 | 21.9 |
| Hispanic | 14.2 | 10.9 |
| Native Hawaiian/Pacific Islander | N/A | 0.1 |
| Two or More Races | 2.4 | 3.2 |
| White | 7.2 | 62.0 |
In terms of Race breakdown at Shelby Count, Black students tend to be the majority with Hispanics following and White at 7.2%, and we can see how this aligns through a holistic sense of racial demographics in Tennessee. With white being the majority at 62% and Black at 21.9%, these numbers show how the biggest county aligns with Tennessee public schools as a whole. We also come to understand or rather assume that although Shelby encompasses a huge student population made up of people of color, other counties house the opposite. This point is an integral part when comparing budgets and counties.
| Racial Demographics, 2018-2019 | ||
|---|---|---|
| Race | Metropolitan Nashville Public Schools (%) | Tennessee K-12 students (%) |
| American Indian/Alaska Native | N/A | 0.2 |
| Asian or Asian/Pacific Islander | 4.0 | 2.0 |
| Black | 39.6 | 21.9 |
| Hispanic | 25.8 | 10.9 |
| Native Hawaiian/Pacific Islander | N/A | 0.1 |
| Two or More Races | 2.2 | 3.2 |
| White | 28.1 | 62.0 |
Metropolitan Nashville Public Schools(MNPS), which is the largest district encompassing Davidson county is more spread in terms of diversity between White students and students of color. However, we can still see a majority of Black students compared to White students.
| Expenditures by Category | |||||||||||||||||
|---|---|---|---|---|---|---|---|---|---|---|---|---|---|---|---|---|---|
| School Year | Staff Expenses | Student Services | Operational Expenses | Debt Service | Other | Budget Total | |||||||||||
| Total | % of Budget | Total | % of Budget | Total | % of Budget | Total | % of Budget | Total | % of Budget | ||||||||
| 2013-2014 | $955,657,389 | 80.5% | $60,823,943 | 5.1% | $145,460,256 | 12.3% | $592,879 | 0% | $24,174,193 | 2% | $1,186,708,660 | ||||||
| 2014-2015 | $728,167,870 | 76.3% | $89,268,427 | 9.4% | $135,831,635 | 14.2% | $658,940 | 0.1% | $0 | 0% | $953,926,872 | ||||||
| Averages: | $841,912,629.5 | 79% | $75,046,185 | 7% | $140,645,945.5 | 13% | $625,909.5 | 0% | $12,087,096.5 | 1% | $1,070,317,766 | ||||||
This table contains the expenditure by specific category. it is important to once again acknowledge how much is spent on student services. Shelby County houses close to 113,000 students.
Comparing Shelby county to Rutherford County, which currently houses close to 47,000
Rutherford County spending on Student Services (2013) $108,344,000
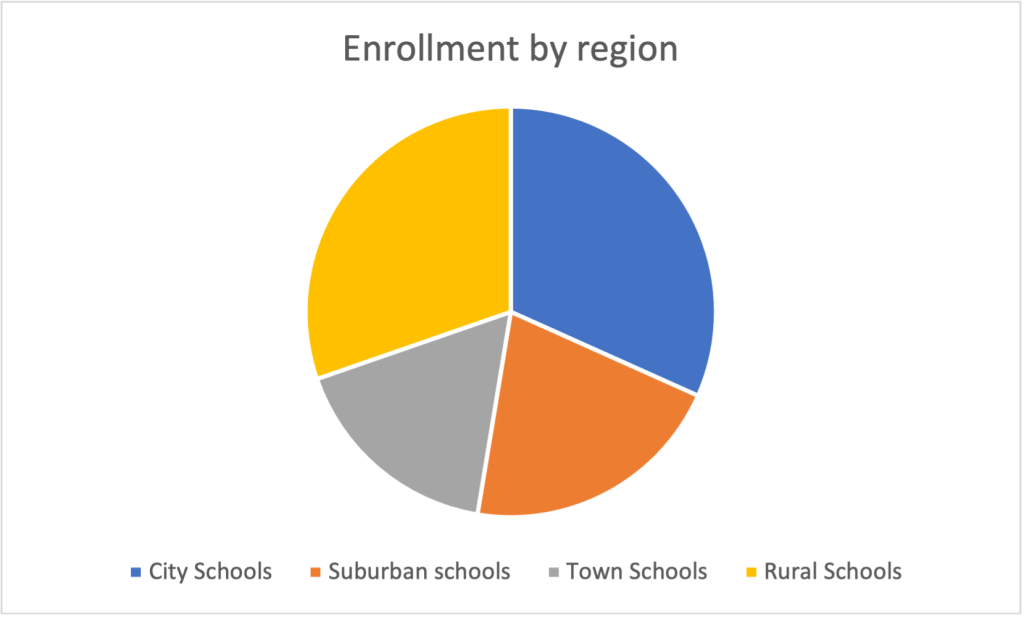
By schools, City and Rural schools are somewhat equivalent to Rural schools. Suburban schools and town schools come out to close to equal.

With expenditures per pupil TN, on average is lower than most surrounding states close by as well as the national average. Accounting for populations (by students) TN is one of the most populated states. An interesting correlation with other states is the student population. Maine (as of 2021-22) has a student population of 173,158 compared to Tennessee’s 900k+ population. Tennessee’s current educational budget is 9 billion(proposed).
Total state public education budget: 11,139 per student
Average national per-pupil expenditure: $15,114 per student
Graduation rate: 88.7%

| National | 58,848 |
| Tennessee | 55,460 |
Within schooling itself, there have been uproars into how much Teachers have been paid. Teachers have gone on strike.

Students have joined with walkouts as well to support these causes.
Other Data
33.5% Economically Disadvantaged
13.5% Students with Disabilities
Average suspension rate :12% percent of students
Number of School districts: 137
Number of public schools: 1,817
Number of private schools: estimated at 600t
Unions: Teacher Education Association (TEA) : 46000 teachers
- supplemental funding
- legislature exposure
- reprimands admin within districts
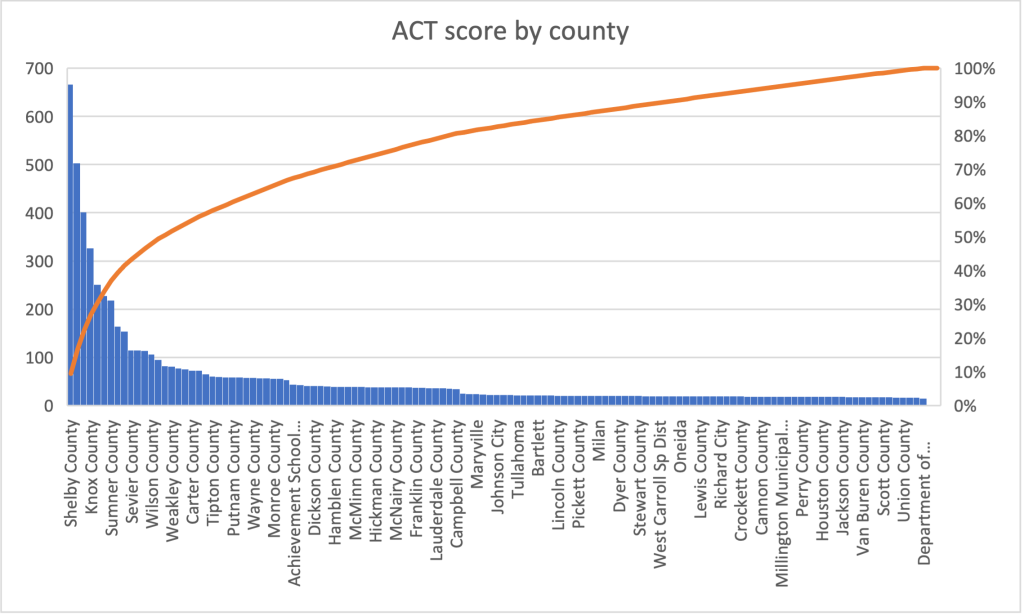
Average ACT in TN: 19.1 (2020-21)………
- Consequences for failing to meet standards—for students, teachers, administrators, and schools: Failure of grade
- Critical Race Theory: Rejected
- Testing or proficiency graduation requirements: For Elementary, Middle School, and High School students participate in TCAP testing (Tennessee Comprehensive Assessment Program)
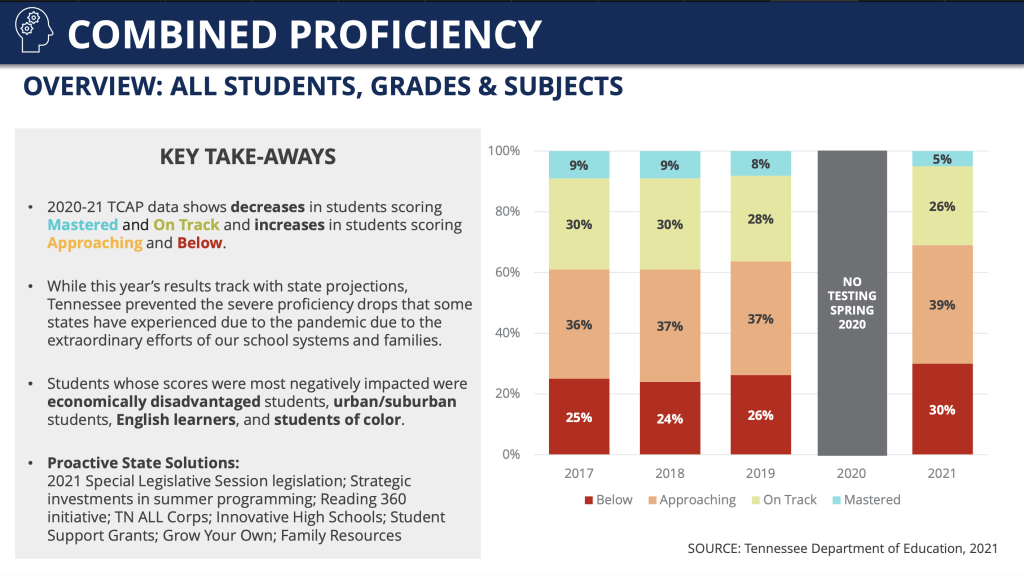
TCAP by the years
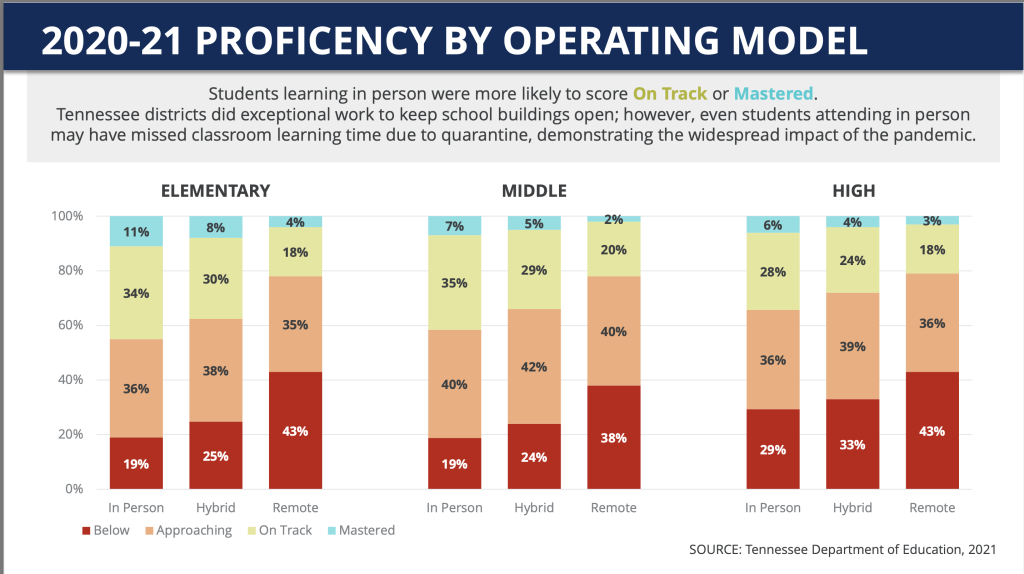
TCAP by Race

TCAP by schools
Data analysis
An ongoing problem for Tennessee’s public schools are the efforts to dilute money to students who need it. States force schools that cannot rely on property taxes to accrue revenue. There is no extra funding to supplement this. School resources are based on funding. How they obtain is up to Federal funds, State funds, and also local property taxes. However, between schools in different areas property tax can differ. We have seen by comparing Shelby county to Rutherford the differences in school funding and the inequalities there. Although Shelby County houses around 113,198 students compared to Rutherford county’s 47,458 students there is still a difference of over 48 million.
| Racial Demographics, 2018-2019 | ||
|---|---|---|
| Race | Rutherford County Schools (%) | Tennessee K-12 students (%) |
| American Indian/Alaska Native | N/A | 0.2 |
| Asian or Asian/Pacific Islander | 4.3 | 2.0 |
| Black | 17.6 | 21.9 |
| Hispanic | 15.4 | 10.9 |
| Native Hawaiian/Pacific Islander | N/A | 0.1 |
| Two or More Races | 3.5 | 3.2 |
| White | 58.9 | 62.0 |
It can also be seen how Rutherford county differs from Shelby county in diversity. Shelby county is predominantly made up of Black students and Hispanic students as opposed to Rutherford County which is made up of predominantly White students.
These are extreme issues when we analyze what these discrepancies ultimately mean for students who are economically disadvantaged. Schools relinquish the ability to create or offer classes of rigor because it depends on whether the school can afford to get a new teacher or books to help. These burdens are then put on the student. If a student comes from a family who cannot afford these “luxuries” and the school cannot as well, the student is left scavenging for them on his/her own. Looking at Rutherford County compared to Shelby County we can see how different these numbers are. Areas of traditional wealth are given a bigger emphasis than counties with low property taxes or areas of low income.
Current News

On February 24, 2022, Governor Lee announced a “9 billion proposal” which would be a revolutionary change in how we address problems in our public educational system. The bill would set the base cost of the per-pupil expenditure to 6.6 billion. This comes with a 1.8 billion in relief/support for students needing the help. This bill, at face value, gives a persuasive argument for helping public schools. It recognizes perpetual issues within our flawed public school system. However, this bill assumes that splashing money at a problem it will fix it.
In this way, we can see how spending neglects to understand the intricacies of perpetual neglect in public school structures. A bill is headlined with a big number and from there it is assumed that through these new bills/ spending schools will receive more funding. In the case that a bill is good in idea and application there is not enough involvement and communication between the state and the districts it is trying to help.
I do believe it starts with funding which has been illustrated through this new bill proposal. Through funding, you recognize the discrepancies in how we deliberate over nuanced issues such as decreased scores from economically disadvantaged students. However, I believe these problems need more than money. Setting up support systems is crucial to seeing not only the success of students but to also promoting longevity in these successes. Splashing money at problems neglects to deter the ongoing havoc these old structures have caused from inequalities in spending to disadvantaged schools with revenue.
Works Cited
https://docs.google.com/document/d/13OP4QolbWYOayJtRiSy8KvYyN4guabwhvwWna7JOHOE/edit?usp=sharing