Virginia Education System
Caroline Vauclain
___________________________________________________________

Compiled Data:
Funding:
Total public school student population (“Digest of Education Statistics”): 1,289,367
Total state public education budget (“Statistics and Reports”): $18.15 billion
-
- $1.12 billion from federal funding, $7.35 billion from state funding, $9.68 billion from local funding
Average per pupil expenditure (“Digest of Education Statistics”): $12,224
High/low per pupil expenditure within state (“Statistics and Reports”):
-
- Lowest: King George School District $8,585
- Highest: Arlington School District $20,543
Average national per pupil expenditure (“Digest of Education Statistics”): $14,134
Demographics (“Digest of Education Statistics”):
In the 2015-16 school year, 25.27% of Virginia students attended schools defined as rural, compared to 18.7% nationally. 45% attended suburban schools, compared to 39.7% nationally. Virginia has a significantly smaller share of their students in city/urban schools than the national average of 30.2%.
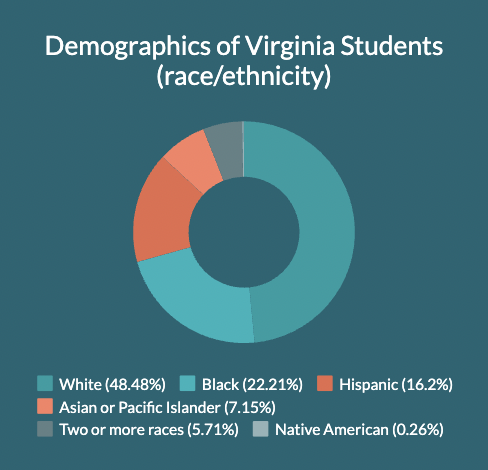
Virginia is a predominantly White state, with White students making up 48.48% of all students. Black and Hispanic students make up the next largest portion of students, with 22.21% Black students and 16.2% Hispanic students.
Graduation Rates (“Digest of Education Statistics”): Total and by Demographics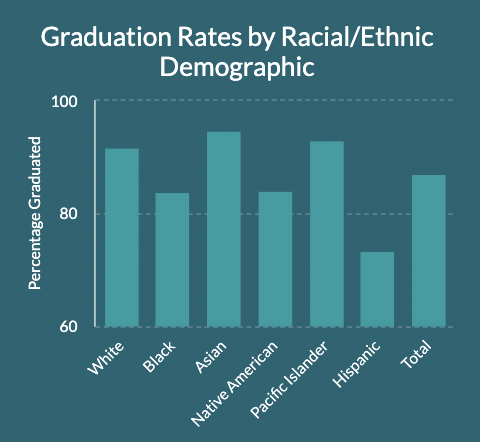 There are clear disparities between the graduation rates of different racial and ethnic groups. Asian students have the highest graduation rate of 94.46% and white students have a similarly high graduation rate of 91.8%. Among the categories listed, Hispanic students have the lowest graduation rate of 73.5%. All of this data is contextualized by the total Virginia graduation rate of 87% and the national graduation rate of 86%.
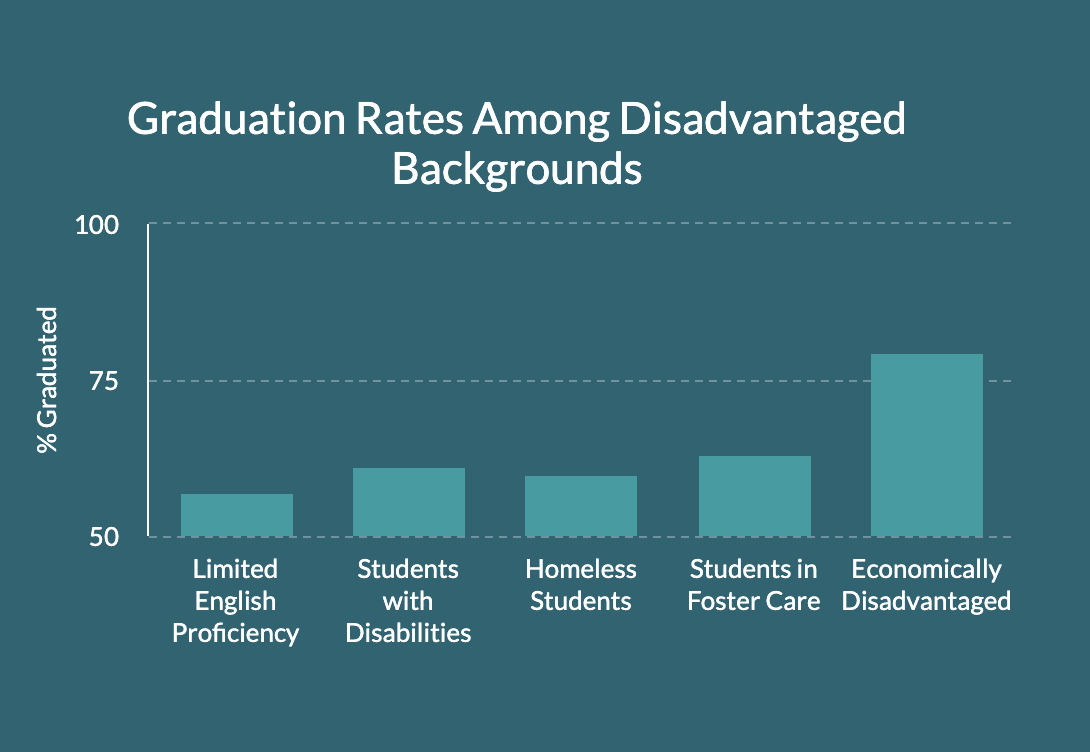 All students with these background have a significantly lower graduation rate than the state average of 87%. The lowest being students with limited English proficiency with a graduation rate of 57.2%.
Accountability measures (“Standards of Learning (SOL)…”): Virginia has not adopted the Common Core or Next Generation Science Standards. Instead, to track student achieve they use their own Standards of Learning (SOL) exams. The SOL exams test students in English, math, science, and history/social studies. English and math are tested every year form 3-8th grade, while science and history are tested in the 4th, 5th, and 8th grade. The material is similar to the requirements of Common Core, but the additions of science and social studies to the SOL exams seem to represent a commitment to more well-rounded testing. Students take SOLs after completing certain high school courses in the subjects covered. Five verified credits, which necessitate passing the end of year SOL, are required for graduation from Virginia public schools.
Results around the state (Graphs from StatCh@t UVA):
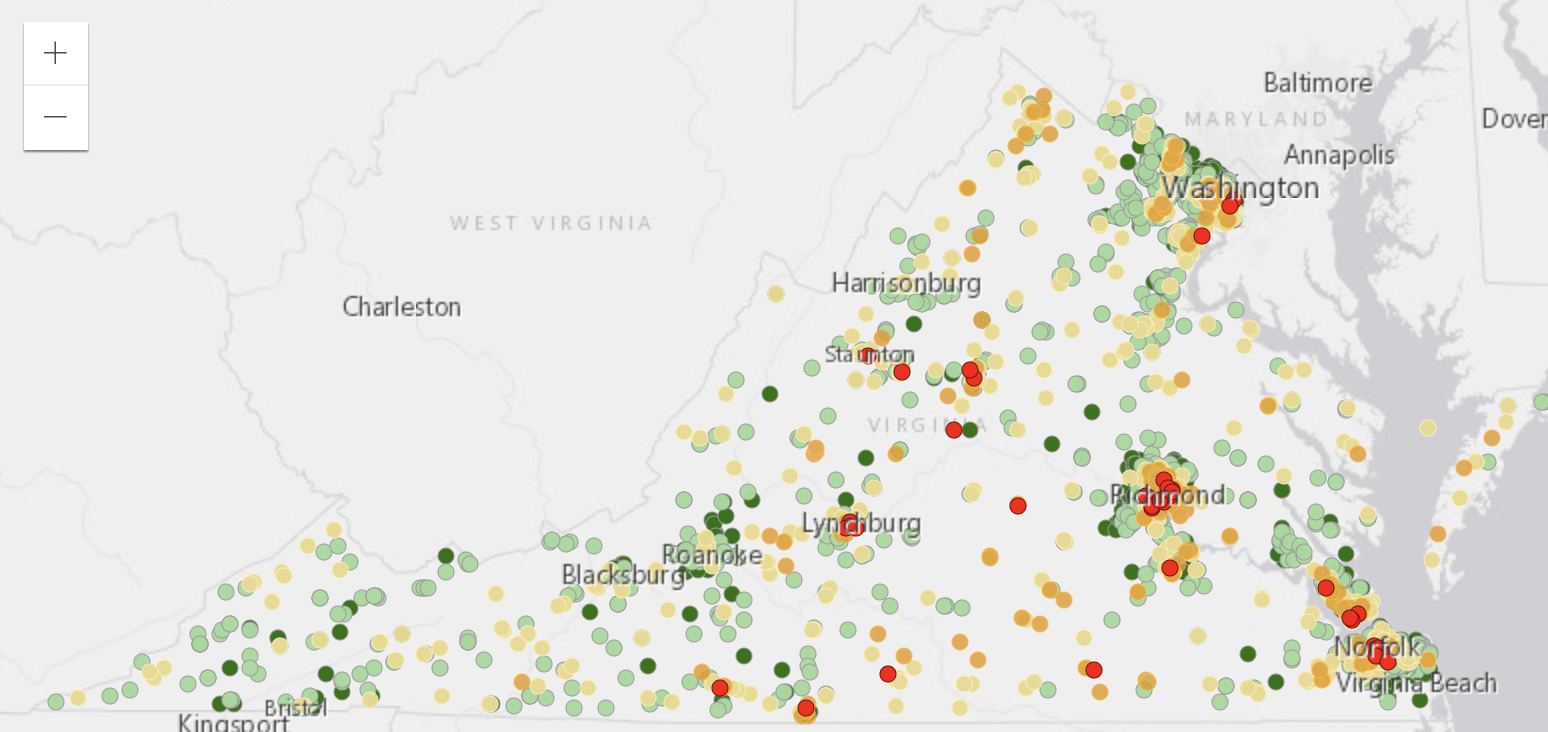 Results are shown above for schools across the commonwealth based on results from the 2014-2015 school year. Green dots represent the highest pass rates, while red dots represent the lowest.
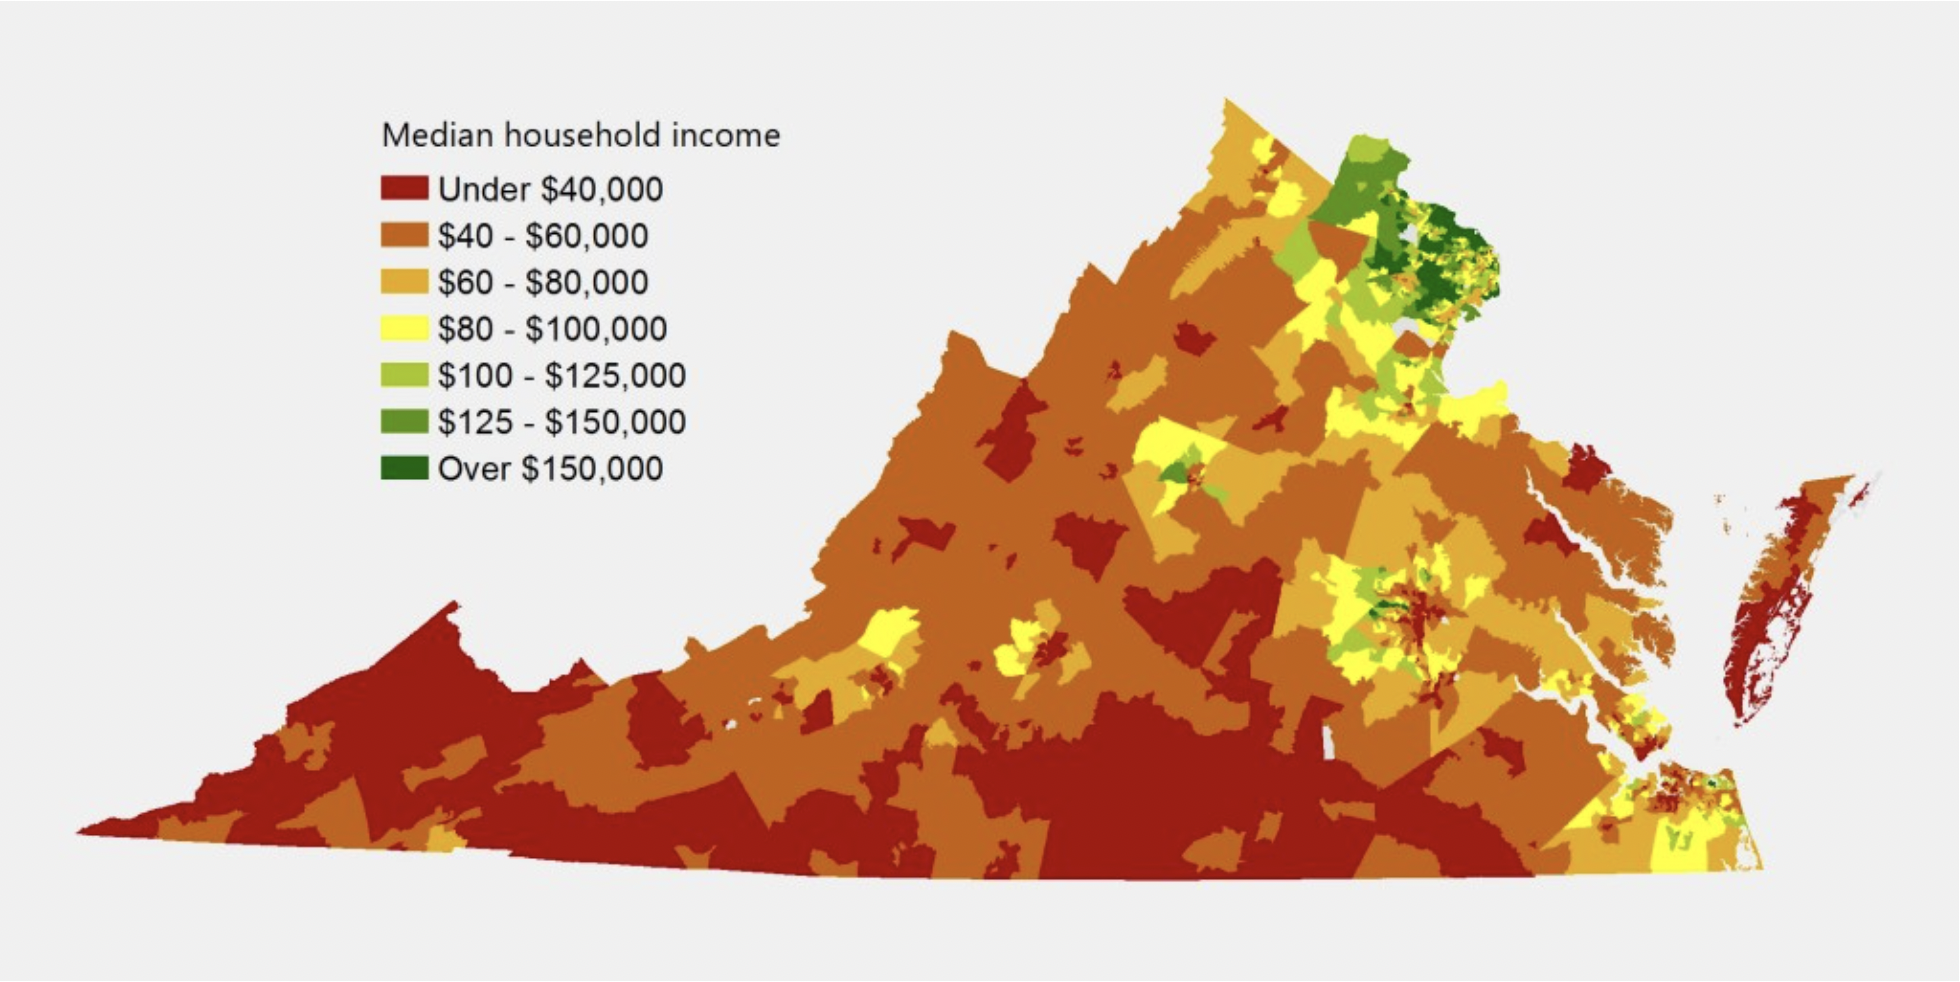
In urban and suburban areas, these graphs show that higher test scores are strongly correlated with median household income. Interestingly, this is not so much the case with rural areas. Particularly in the south west corner of the state, which is relatively rural and low income, test scores are very good.
School Choice, Charter Schools, and Vouchers:
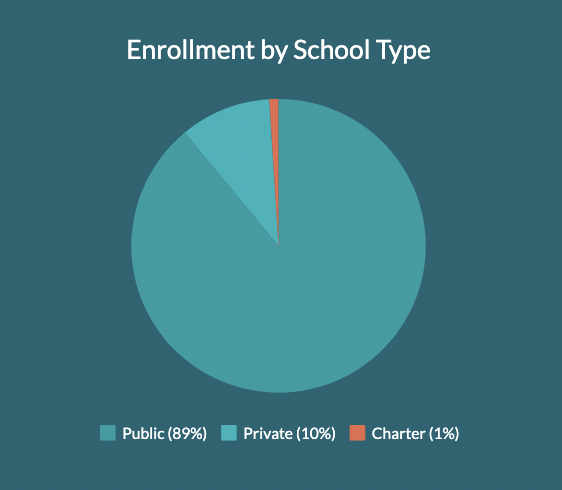
Around 10% of Virginia students are enrolled in private schools, which is in line with the national average. There are only 7 charter schools in the Commonwealth of Virginia, and they serve less than 1% of Virginia students. Two of these seven charter schools are in the county with the highest median household income (“Statistics and Reports”).
Parents in Virginia have the option to choose between traditional public, charter, magnet, and private schools. Virginia also has “open enrollment” policies that vary by district, meaning in some districts parents are permitted to enroll their children in the school regardless of what district their residence is in (“Virginia School Choice Roadmap”).
Virginia has a state-run scholarship program that provides scholarships for students to attend private schools. Students are eligible to receive a scholarship if the student’s family income is below 300% of the federal poverty level or if the student has special needs. The scholarships average around $2,799 (average Virginia private school tuition is $12,936 for elementary schools and $16,673 for high schools). Around 37% of Virginia students are eligible for these scholarships and 0.3% use a scholarship. There do not appear to be restrictions on the type or religious affiliation of the private school (“Virginia School Choice Roadmap”).
Teachers:
Average salary of Virginia teachers: $59,267 (“Digest of Education Statistics”)
Average national teacher salary: $65,090 (“Digest of Education Statistics”)
According to Politifact, “Virginia teachers’ pay ranks last compared to full-time, year round workers.” Nationally, the average teacher salary is 9% lower than the average of all full-time workers. In Virginia, the average teacher salary is 29% lower than the average of all full-time workers (Fiske).
Virginia has several prominent teachers unions such as the Virginia Education Association (VEA). As of May 2021, Virginia’s ban on public-sector employees, including public school teachers, collective bargaining was lifted. However, Virginia requires employees to gain approval from the local governing body, which for teachers means approval from their local school board. As of February 2022, educators in Richmond became the first to win collective bargaining rights (Snow).
Data Analysis:
https://docs.google.com/document/d/1sLqyt_MO3GC1I8uid310O9kKc2B4cD3jLEvWXZzcj-w/edit
Sources: https://docs.google.com/document/d/1ZB7x0UiBk4OXmYHmLYaeiZZjjgXctDxTHT6uaddXw2Y/edit