
Student Demographics


- Total Public School Student Population (Fall 2020, PK-12)
- 1,087,354 (“Enrollment in Public Elementary and Secondary Schools, by Level, Grade, and State or
Jurisdiction: Fall 2020”)
- 1,087,354 (“Enrollment in Public Elementary and Secondary Schools, by Level, Grade, and State or
- 11.8% of students are English Language Learners (“COE – English Language Learners in Public Schools.”)
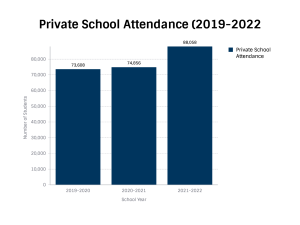
- Private School Attendance
- Students in private schools have increased over the past 2-3 years, but the number of private schools themselves have somewhat fluctuated.
Budget and Spending


- Federal, state, and local governments budget $584.9 billion or $14,418 per pupil to fund K-12 public education (Hanson).
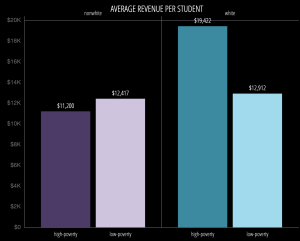
- Predominantly non-White school districts on average have less funding than predominantly White school districts regardless of poverty levels.
Testing and Accountability
- Learning Standards
- Washington adopted Common Core in 2011 for English Language Arts and Mathematics (“Learning Standards and Best Practices for Instruction | OSPI”).
- The state also adopted the Next Generation Science Standards as the Washington State Science Learning Standards in 2013 with assessments based off the standards rolled out in 2018 (“Science K–12 Learning Standards | OSPI”)
- Standardized Testing
- Smarter Balanced Assessments (SBA): ELA and Math tests for grades 3-8 and 10 for federal and state accountability. The high school ELA and Math assessments can be used for graduation pathway requirements (“State Testing | OSPI”).
- “...assists districts and schools in improving instructional practices and curriculum and gives families valuable information about how well their student is doing and where additional help might be needed… Together with report cards and other information, test results let you know if your student is on track to succeed in higher grades as well as for college and career” (“State Testing Frequently Asked Questions | OSPI”).
- Washington Comprehensive Assessment of Science (WCAS): science assessments for grades 5, 8, and 11 for federal and state accountability.
- Washington – Access to Instruction and Measurement (WA-AIM): “ELA, math, and science alternate assessments for students in grades 3–11 with significant cognitive disabilities documented in their Individualized Education Program (IEP) for federal and state accountability. The high school ELA and math assessments can be used to meet a student’s graduation pathway requirement.
- OSPI-Developed Assessments and OSPI-Developed Performance Assessments: classroom-based assessments for the arts, educational technology, health and physical education, and social studies based on the state’s learning standards to guide instruction.
- WIDA: used for English Language learners to determine ELD eligibility.
- National Assessment of Educational Progress (NAEP): a national test that requires every state to assess reading and math at grades 4 and 8 every two years (“State Testing | OSPI”).
- Smarter Balanced Assessments (SBA): ELA and Math tests for grades 3-8 and 10 for federal and state accountability. The high school ELA and Math assessments can be used for graduation pathway requirements (“State Testing | OSPI”).
- Consequences for Failing to Meet Standards
- High School Students
- Results are necessary in order to have a complete High School and Beyond Plan which is a graduation requirement.
- 10th grade ELA and Math results are also used to determine courses for the next two years of high school. Demonstration of standards allows for greater course-taking flexibility.
- Schools and Districts
- Schools and districts that fall below a 95 percent participation rate on state tests jeopardize eligibility for any state or federal awards or recognitions (“State Testing Frequently Asked Questions | OSPI”).
- High School Students
- Graduation Requirements
Charter Schools and School Choice
- Less than 1% of students attend charter schools, compared to 7% of students nationwide (“COE – Public High School Graduation Rates”)
- “Washington State’s Charter School Act (RCW 28A.710) was enacted on April 3, 2016. The primary purpose of Washington’s Charter School Act is to allow flexibility to innovate in areas such as scheduling, personnel, funding, and educational programs to improve student outcomes and academic achievement of “at-risk” student populations. A Washington charter public school is a public school that is not a common school: a public alternative to traditional common schools” (“CHARTER SCHOOLS ANNUAL REPORT December 2019”)
- Washington State does not have a school voucher program (“Vouchers – Education Commission of the States”).

Teachers
- Average Teacher Salary (2020-2021)
- Nationwide: $65090
- Washington: $79529 (“Estimated Average Annual Salary of Teachers in Public Elementary and Secondary Schools, by
State: Selected Years, 1969–70 through 2020–21″)
- Washington has affiliate unions of the National Education Association and the American Federation of Teachers
- The WEA has more than 80,000 members and the AFT 6,500 members (“Member Benefits | Washington Education Association”) (“About Us”)
- Merit Pay
- Washington doe not support performance pay (“NCTQ: Yearbook: Pay Scales and Performance Pay: Washington”).
- They do offer a bonus for National Board Certified Teachers
- Board certified the entirety of the year: $5705
- Qualifying high-poverty schools: additional $5000
- Receive certification during the year: receive 60% of the bonus in the first year and the rest during the next (“Washington State National Board Certified Teacher Bonus | OSPI”)
- Teachers who earned higher salaries in their first year of employment (2011-2012 or 2012-2013) were more likely stay through 2016-17 (“Teacher Salaries | Visualizing Washington’s Teacher Workforce | REL Northwest”)
- Teacher Evaluation Methods
- Adopted Teacher and Principal Evaluation and Growth Program (“TPEP”)
- Goals: “High quality teaching and leading are key to student success, Growth in practice is developmental in nature, Growth occurs best when there are clear standards of practice supported by quality professional learning and learning-focused feedback, Evaluation systems should reflect and address the career continuum, The focus for teacher and principal growth should be driven by student learning needs”
- Different guidelines for: teachers/principals/assistant principals scheduled for a focused evaluation, teachers and principals/assistant principals who have completed their
five-year cycle of focused evaluations, new educators or new to Washington, teachers in their final year of provisional status, and teachers/principals on probation on path to probation (“Teacher/Principal Evaluation Program | OSPI”)
- Adopted Teacher and Principal Evaluation and Growth Program (“TPEP”)

Smith
Analysis of Data and Inequities
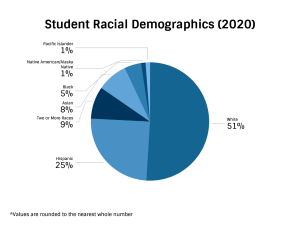
The main inequity is that of racial inequity. There are racial disparities present in funding and graduation rates. Regardless of poverty rates, predominantly non-White school districts typically have less in funds than predominantly White school districts. On average, high poverty, non-White districts have $11,200 per student; low-poverty, non-White school districts have $12,417 per student; high-poverty, White school districts have $19,422 per student; and low-poverty, White school districts have $12,912 per student (“23 Billion”). Additionally, the graduation rate in Washington is 80.9% and Native American/Alaska Native, Pacific Islander, Hispanic, and Black students fall below this average. The graduation rate fo Native American/Alaska Native students falls as low as 60.4%, 20% lower than the state average (“Graduation and Dropout Statistics 2019”).
Because predominantly White areas are typically more affluent, racial and socioeconomic equities often go hand-in-hand. More affluent areas are usually able to afford better quality education as the property values are more likely to be higher. This, however, is not always the case as even districts that are low-poverty and predominantly non-White typically have less in funding. The graduation rate disparity can be attributed to the lack of diversity in the teaching profession and education as a whole. The teaching profession is an overwhelmingly White one and Black students often do better academically when they have at least one Black teacher. 87.7% of Washington’s teachers are White, whereas only 51.1% of Washington’s students are White (Smith). Becoming a Teacher follows Laquisha Hall who is a Black teacher in a school with a predominantly Black student body. In the case of Hall and her colleagues, they tailored the curriculum to the interests and needs of their students in order for them to be better motivated and engaged (Anderson).
Where Washington addresses inequities is in its commitment to common schools. Charter schools were only allowed in Washington in 2016 and make up not even a percent of students statewide. Additionally, Washington does not have a statewide school voucher program for students to opt out of their public schools for a private option. Charter schools in Washington were created for the purpose of being an alternative option “to allow flexibility to innovate in areas such as scheduling, personnel, funding, and educational programs to improve student outcomes and academic achievement of “at-risk” student population” (“CHARTER SCHOOLS ANNUAL REPORT December 2019”). Alternative education pathways are definitely needed for many students, but charter schools and the idea of school choice is a divisive one for historically closing predominantly Black and low-income common schools and their ability to deny some students’ enrollment.
Additionally, Washington stands out compared to other states in paying their public school teachers on average well above the national average. The average pay for teachers nationwide in 2020-2021 was $65,090 whereas the Washington average was $79,529 (“Estimated Average Annual Salary of Teachers in Public Elementary and Secondary Schools, by State: Selected Years, 1969–70 through 2020–21″). In paying teachers a higher salary, they are less likely to leave the profession shortly after starting which in turn creates a better, consistent experience for students.
Current Event in Washington State Education
In response to students reading below grade level on standardized tests, Wenatchee and other cities in Washington state have responded by adopting a new method of teaching reading and literacy called structured literacy. Traditionally, children were taught how to read using a method called whole language which taught students how to read and write through exposure to books and context clues. Structure Literacy consists of “phonological awareness, the ability to notice and distinguish different sounds in a word; phonics, the ability to match sounds to letters; orthography, the ability to write sounds down and spell words; and morphology, the knowledge of word roots, prefixes and suffixes,” a much more brain science leading approach to literacy. This method of instruction is said to prevent dyslexia, which affects one-fifth of the population. A new state law that mandates students in grades K-2 be screened for dyslexia.
In 2019, only 35 percent of Washington fourth graders were proficient in reading according to the National Assessment of Education Progress. With structured literacy instruction, the goal is to get 95 percent of students at grade level in third grade. A quarter of one class met standards (a rise from 16 percent) and 61 percent met standards in phonics (up from 33 percent). Additionally, many in Wenatchee are from a working class background where English is not the primary language at home so phonics instruction is especially important (Bazzaz).
The case of Wenatchee adopting new instructional methods is an example of a school district using their test scores in order to better assess instruction and make changes accordingly. It is also an example of addressing inequities present in their schools. While standardized testing has historically been used as a determining factor in funding (and still is in the case of Washington when 95% of students in a school do not participate in testing) the Wenatchee schools have utilized their testing data well. The standardized tests that the state administers “assists districts and schools in improving instructional practices and curriculum and gives families valuable information about how well their student is doing and where additional help might be needed” (“State Testing Frequently Asked Questions | OSPI”). Because many students in Wenatchee do not primarily speak English at home, it is critical that they address the issue rather than punish the students and the school by closing them. 11.8 percent of Washington students are English Language Learners (“COE – English Language Learners in Public Schools”). So, this new approach to literacy is crucial to getting them on the path to success with the challenges of going through school while learning a new language.
Works Cited
https://docs.google.com/document/d/1ouO4-KMbDl5p2tNDLSqb9Xin515NTJ_uBHi_s8r270o/edit?usp=sharing