
© Franco Brambilla, “Robotics” illustration for Motherboard Italia (2017)
- Infographics about SF media
- Infographics about alien life
- Infographics about human life
- Infographics about computer “life”
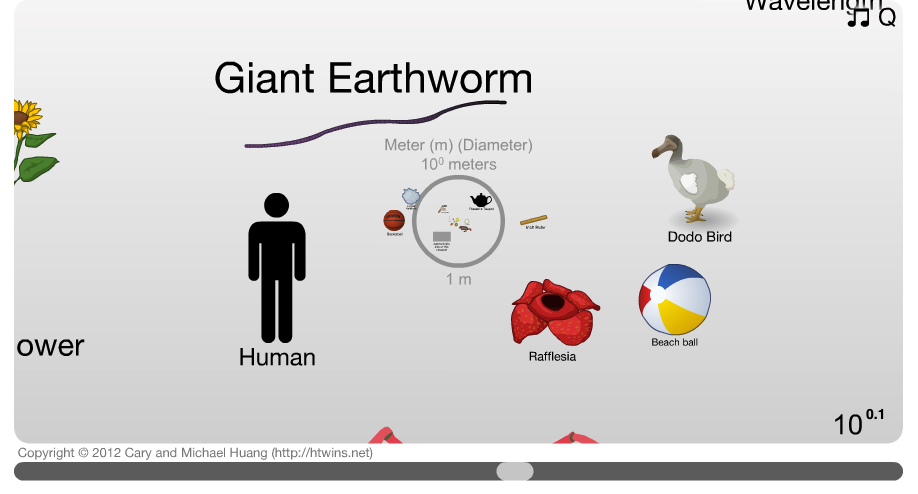
- Interactive graphics
INFOGRAPHICS ABOUT SF MEDIA:
-Ward Shelly, History of Science Fiction map
-SF signal: top 100 SF and fantasy books flowchart (according to NPR)
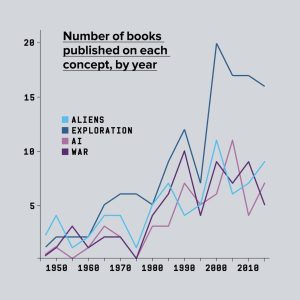
–“100 Years of Sci-Fi, Explored” (Wired) contains a number of interesting infographics about Sci-Fi, a few examples of which are below: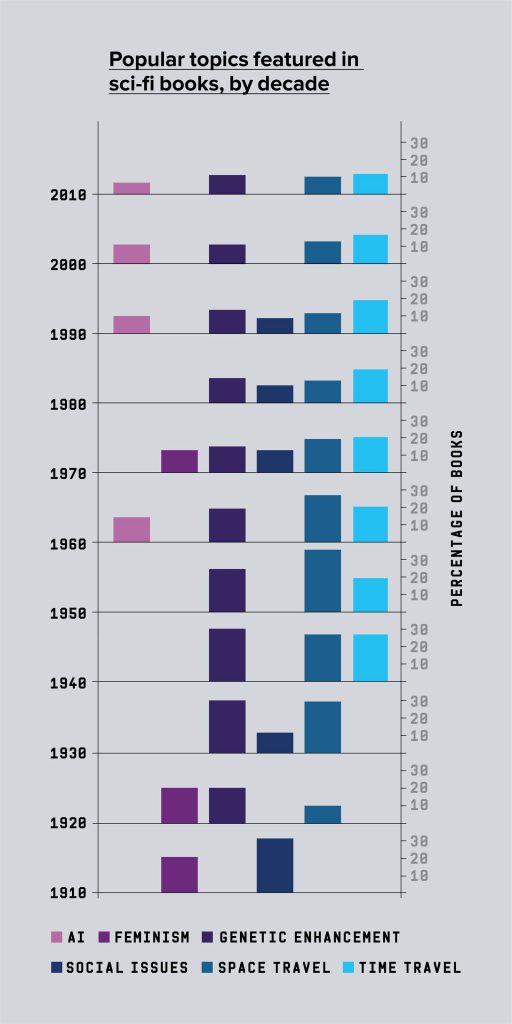
INFOGRAPHICS ABOUT ALIEN LIFE:
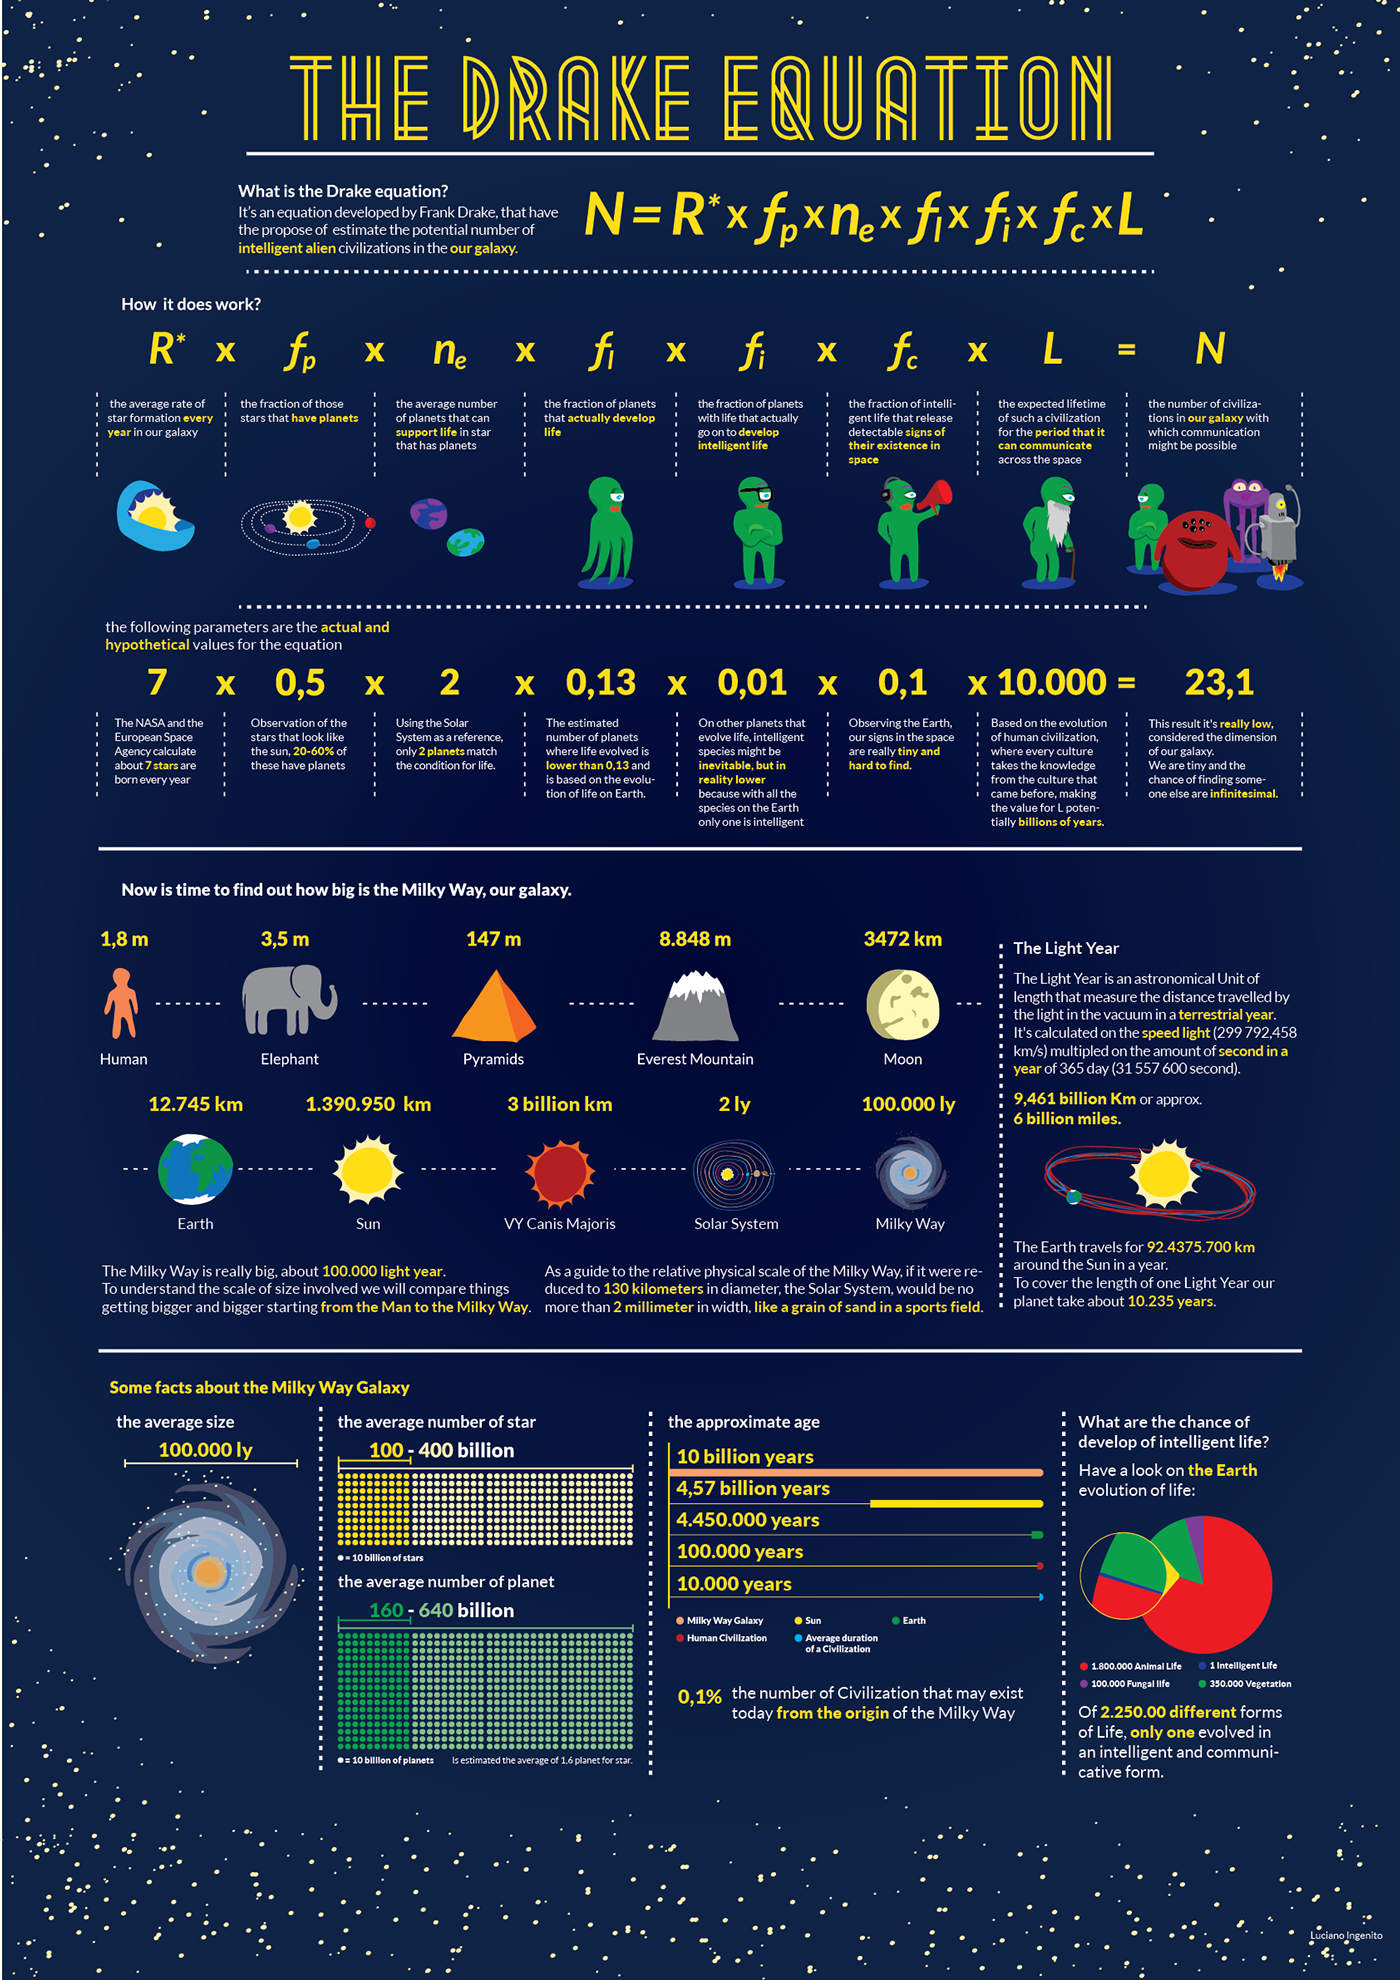
-Drake Equation: SETI’s (Search for Extraterrestrial Life) view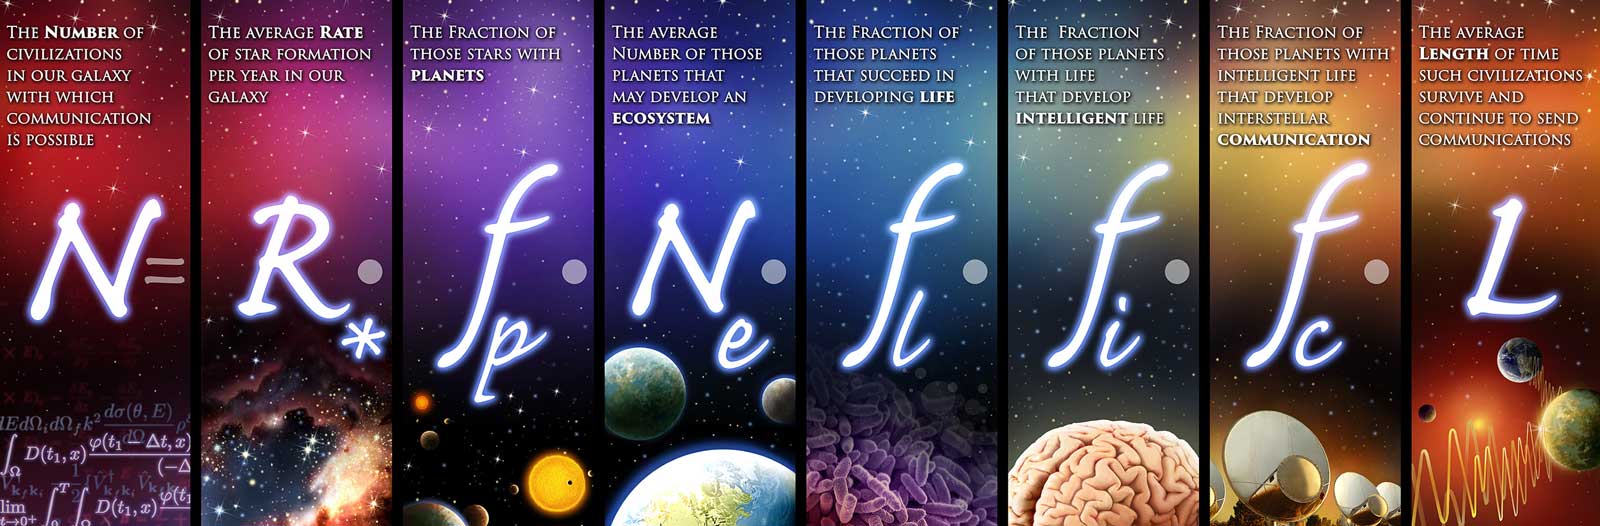
-Drake Equation: NASA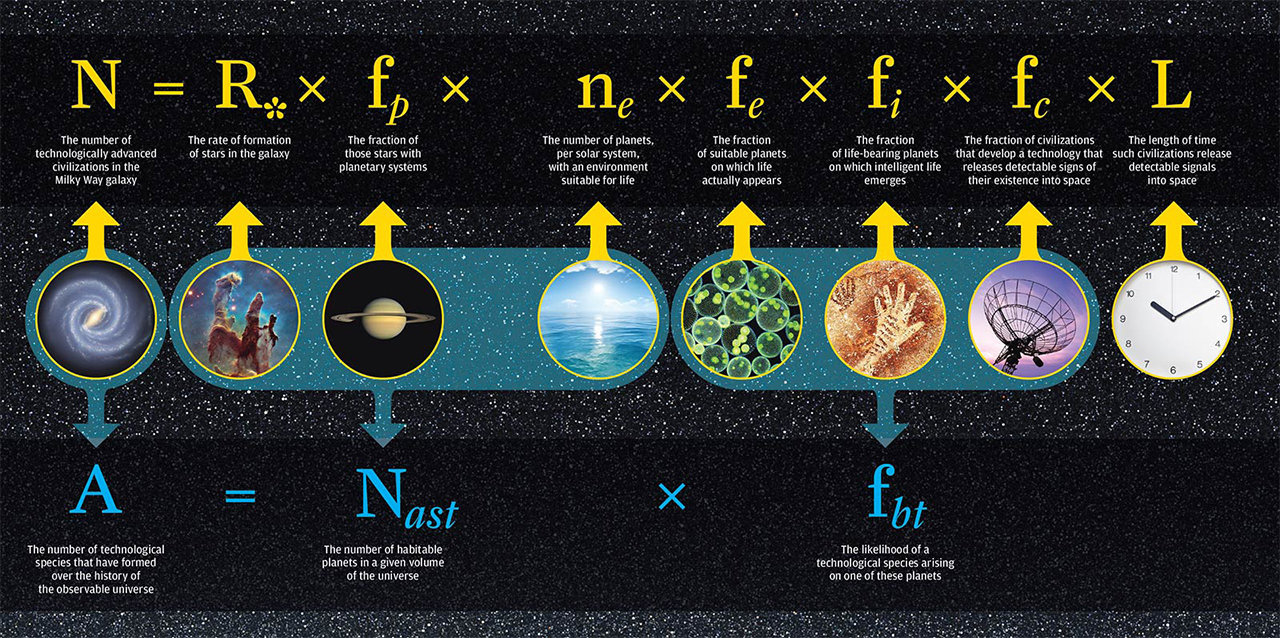
-The Fermi Paradox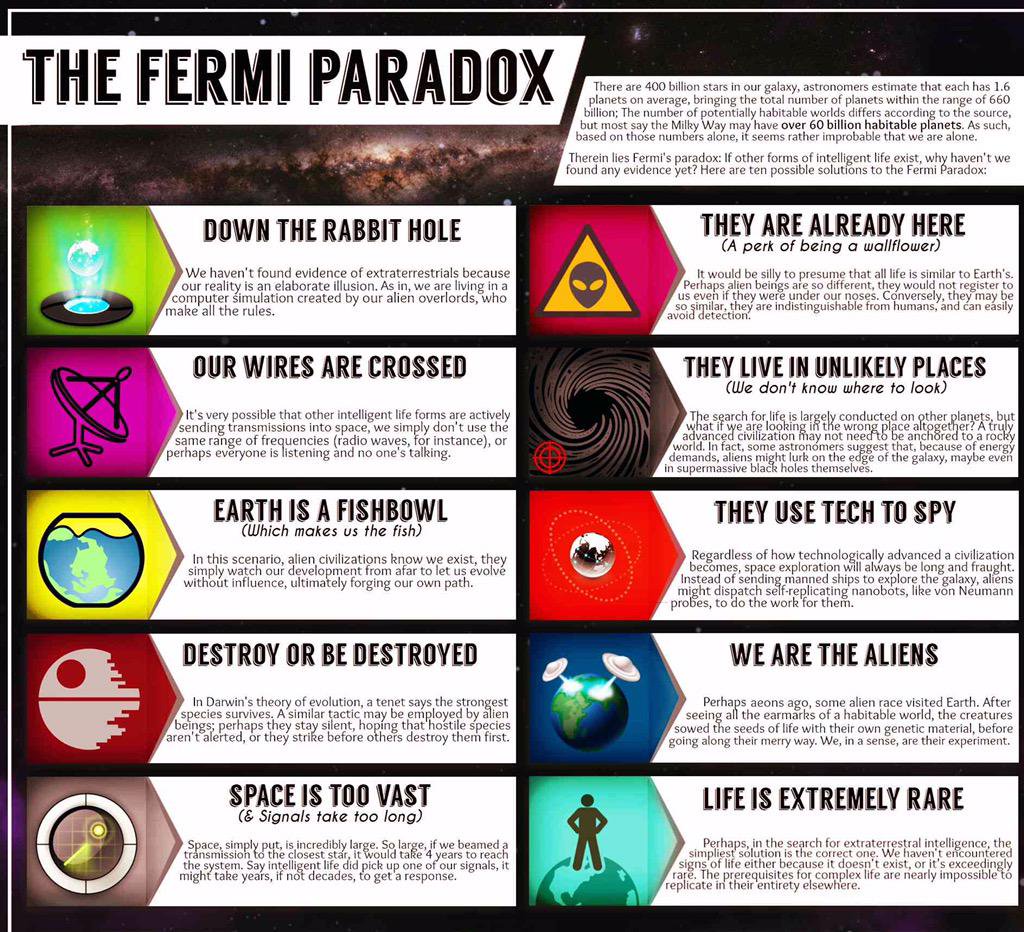
-See this excellent explanation of the Fermi Paradox
-The Great Filter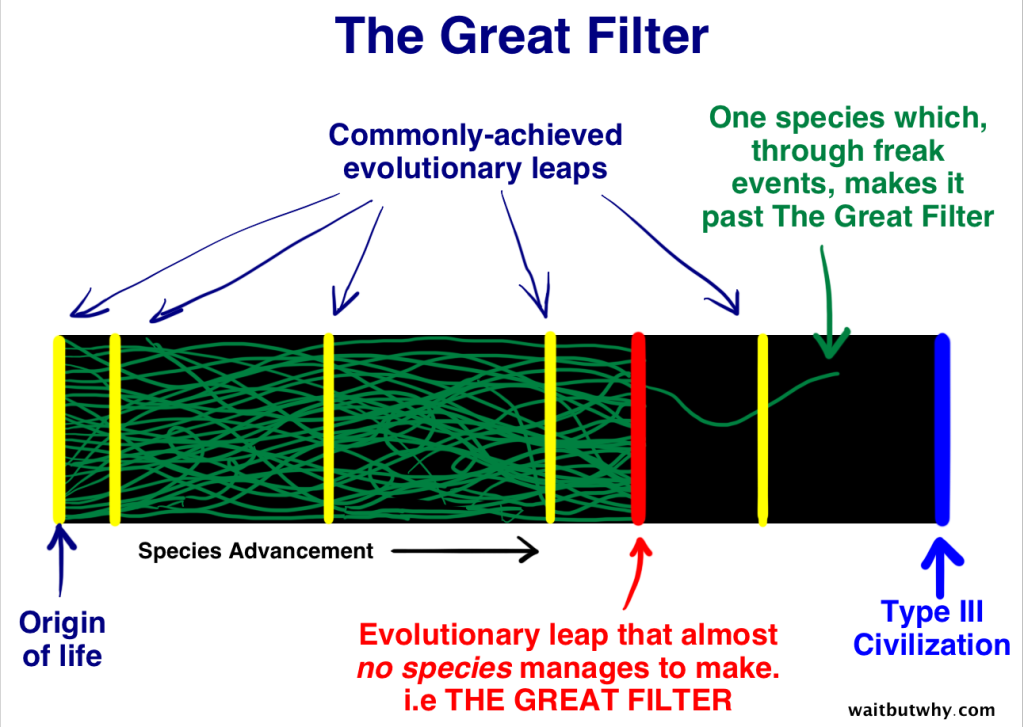
-The Kardashev Scale (Wikipedia article here)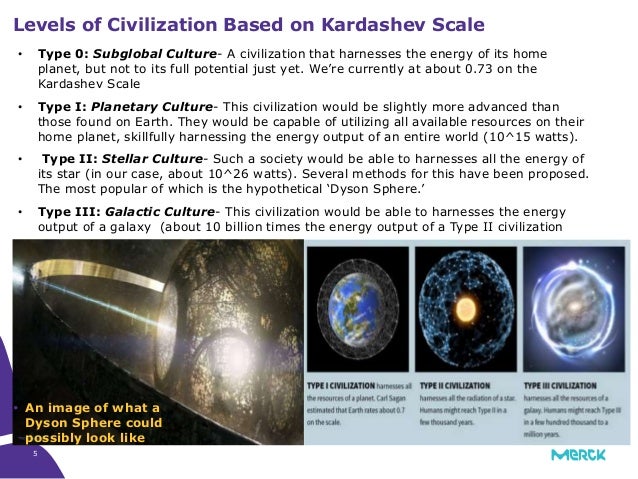
INFOGRAPHICS ABOUT HUMAN LIFE:
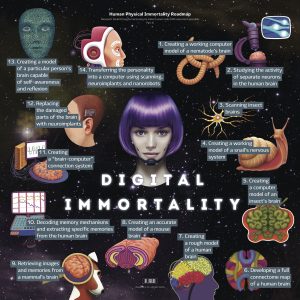
-The human physical immortality roadmap is a collection of infographics exploring how humans could feasibly attain immortality. It includes:
1) Cyborgization
2) Artificial Intelligence
3) Regenerative Medicine
4) Digital Immortality
5) Anti-Aging Genetic Engineering
6) Nanomedicine
7) Cryonics
Two examples are presented below: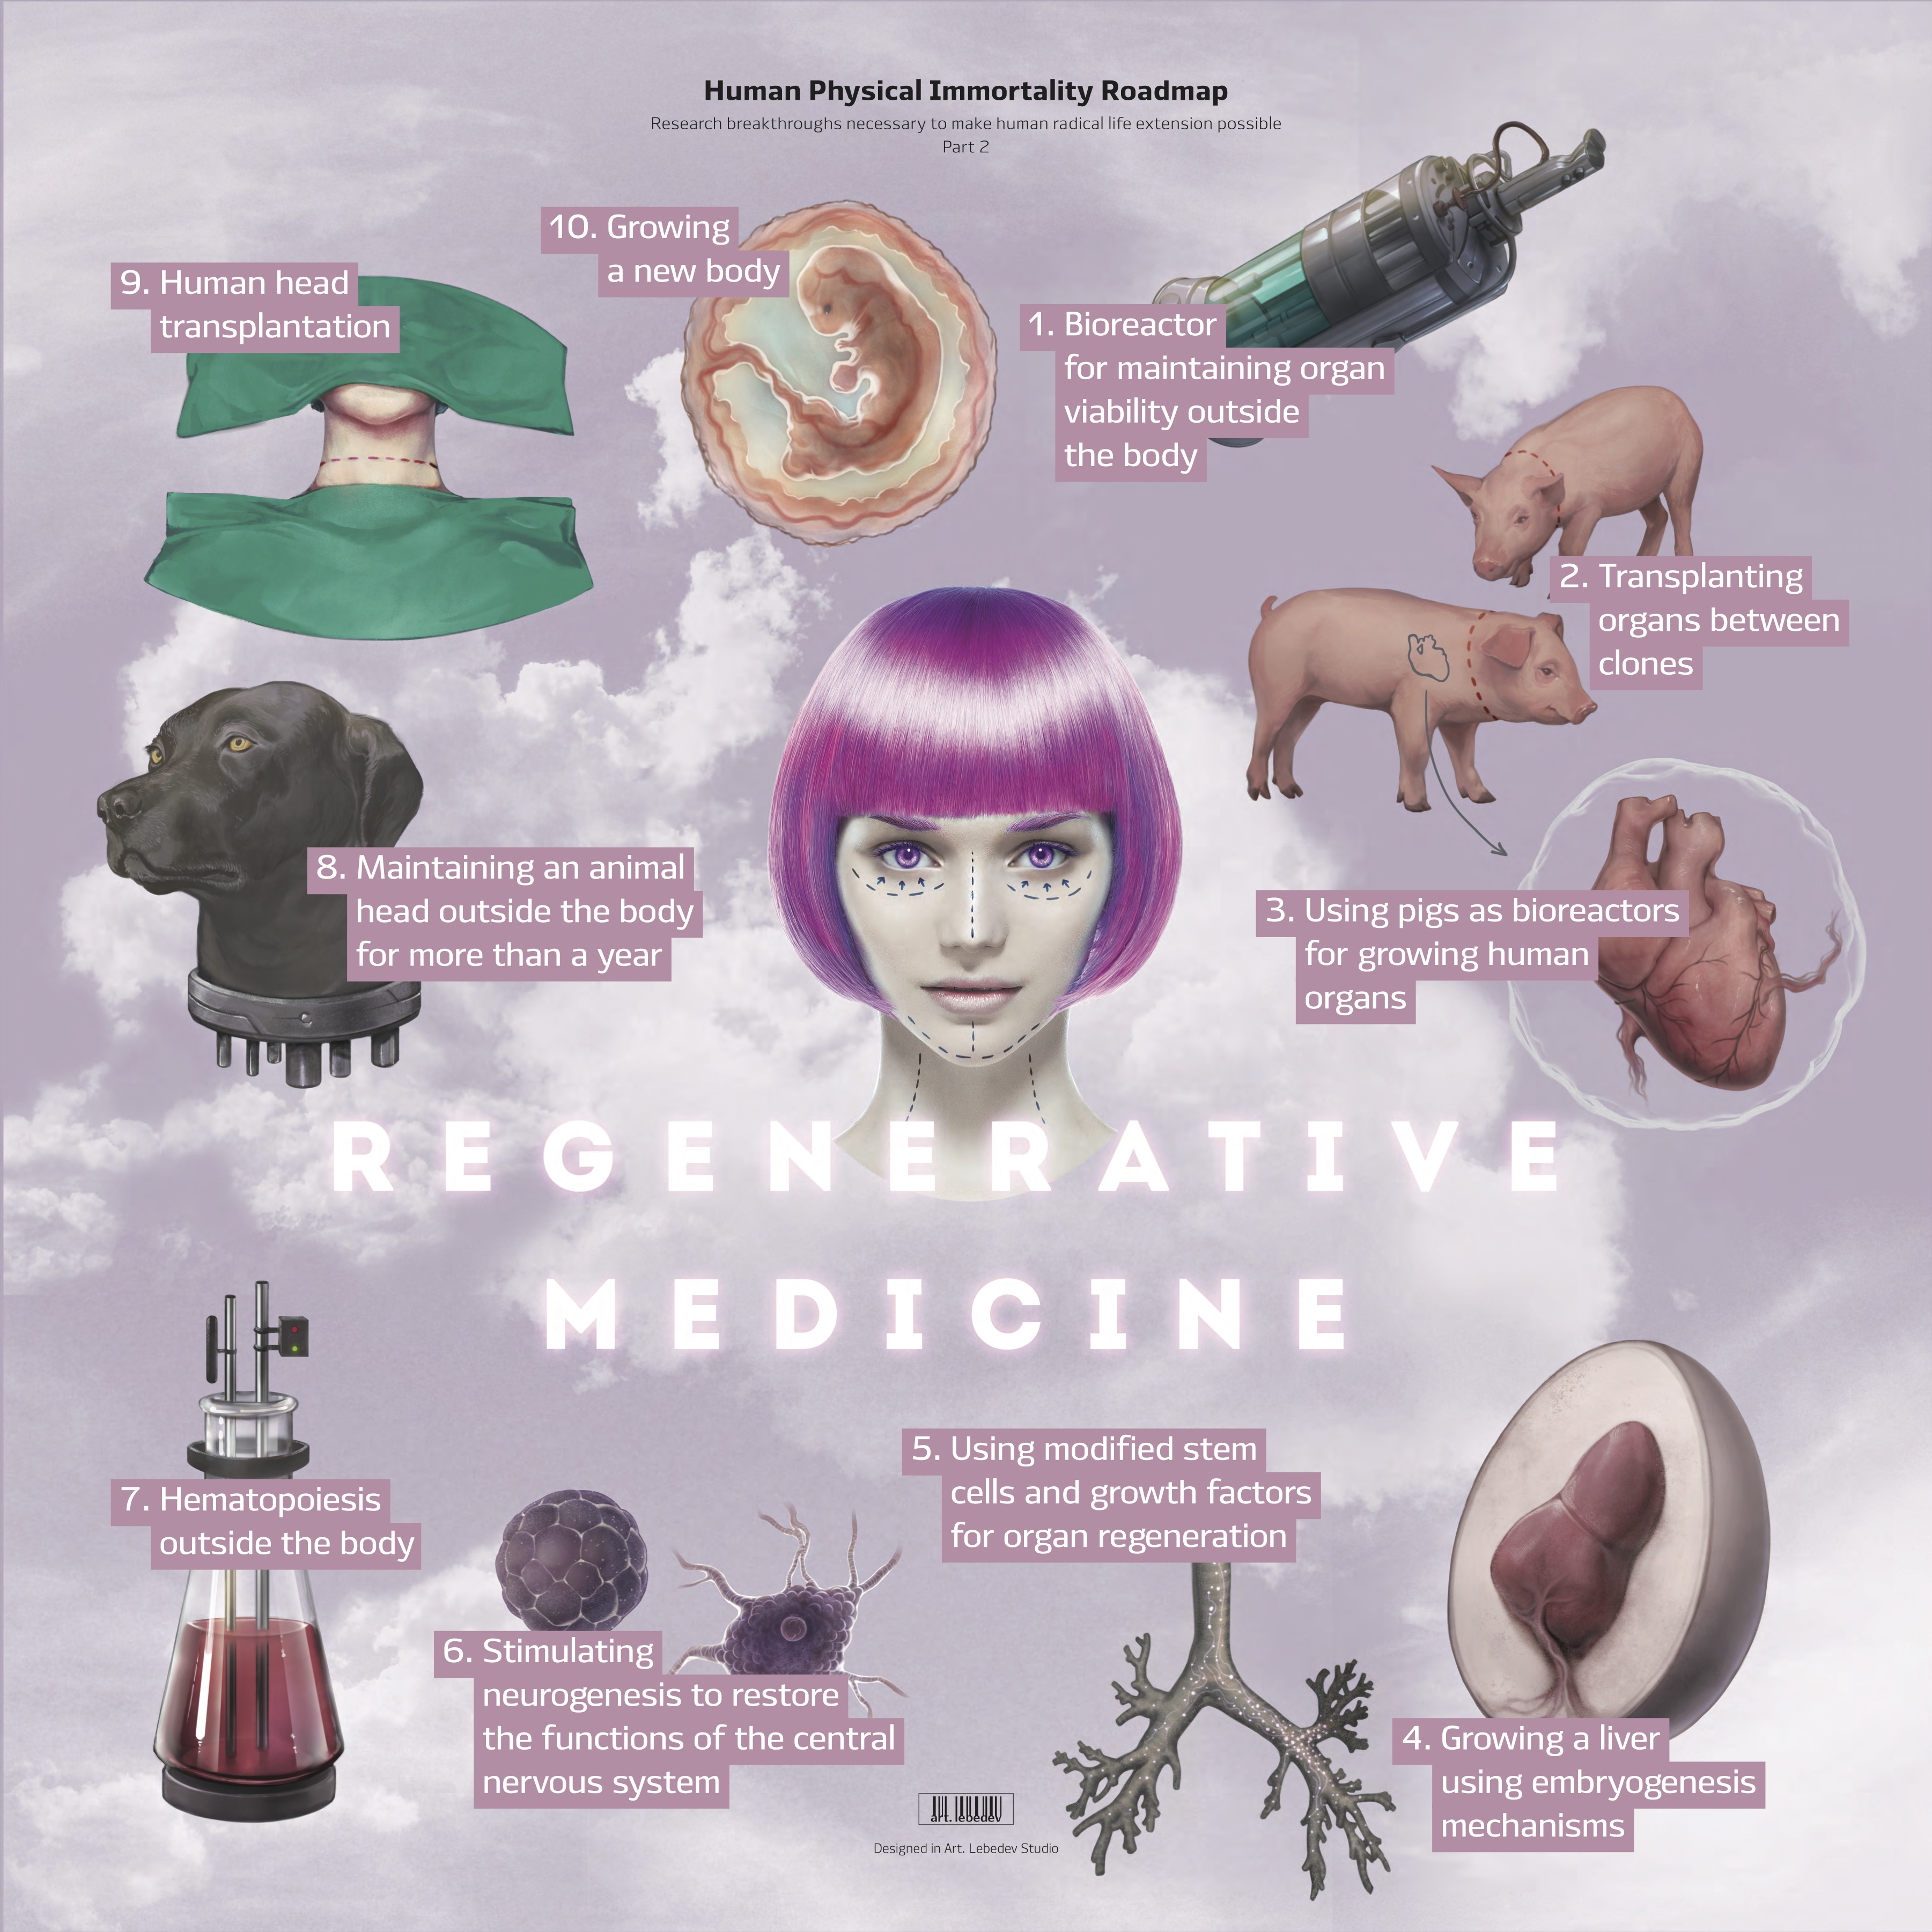
INFOGRAPHICS ABOUT COMPUTER “LIFE”:
-The Singularity (Wikipedia article here)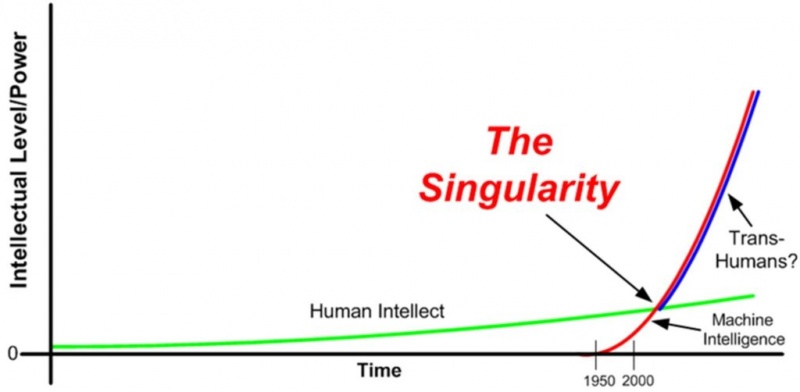
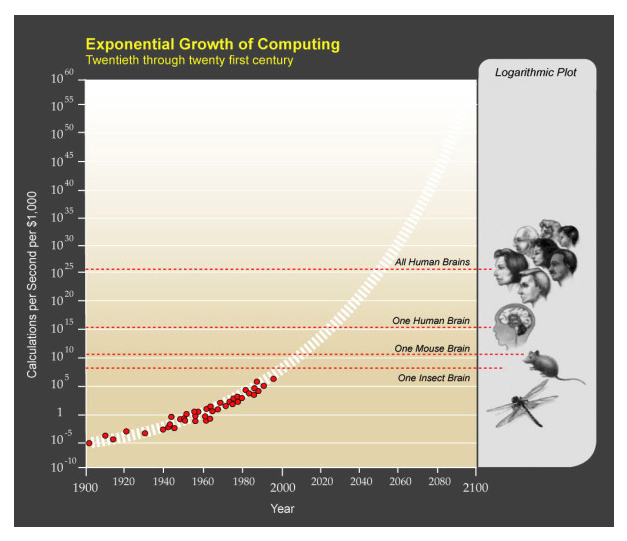
-Excellent article by Tim Urban, “The Road to Superintelligence”
-A great, briefer article on the singularity by Lev Grossman
-An AI timeline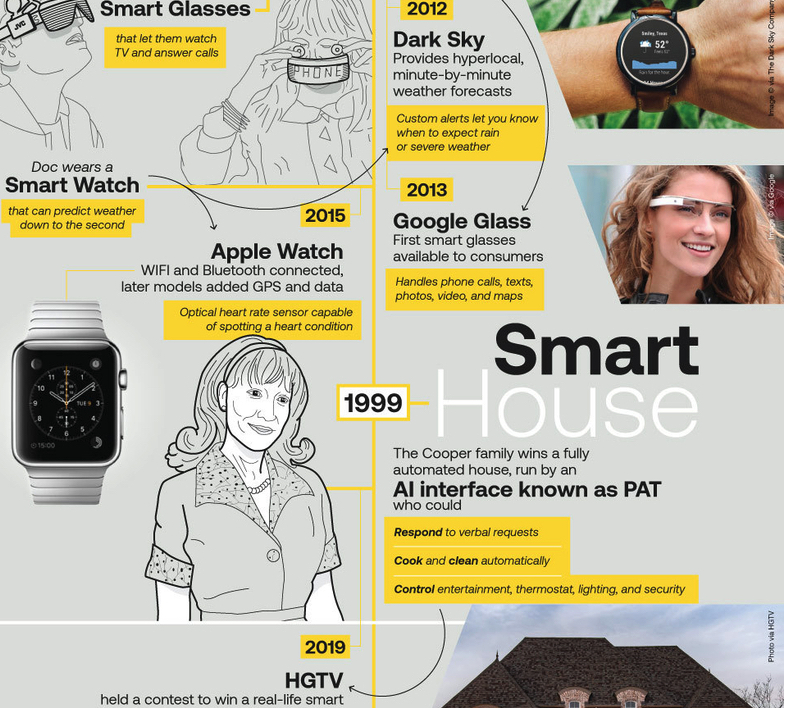
INTERACTIVE GRAPHICS:
–100 years of SF novels mapped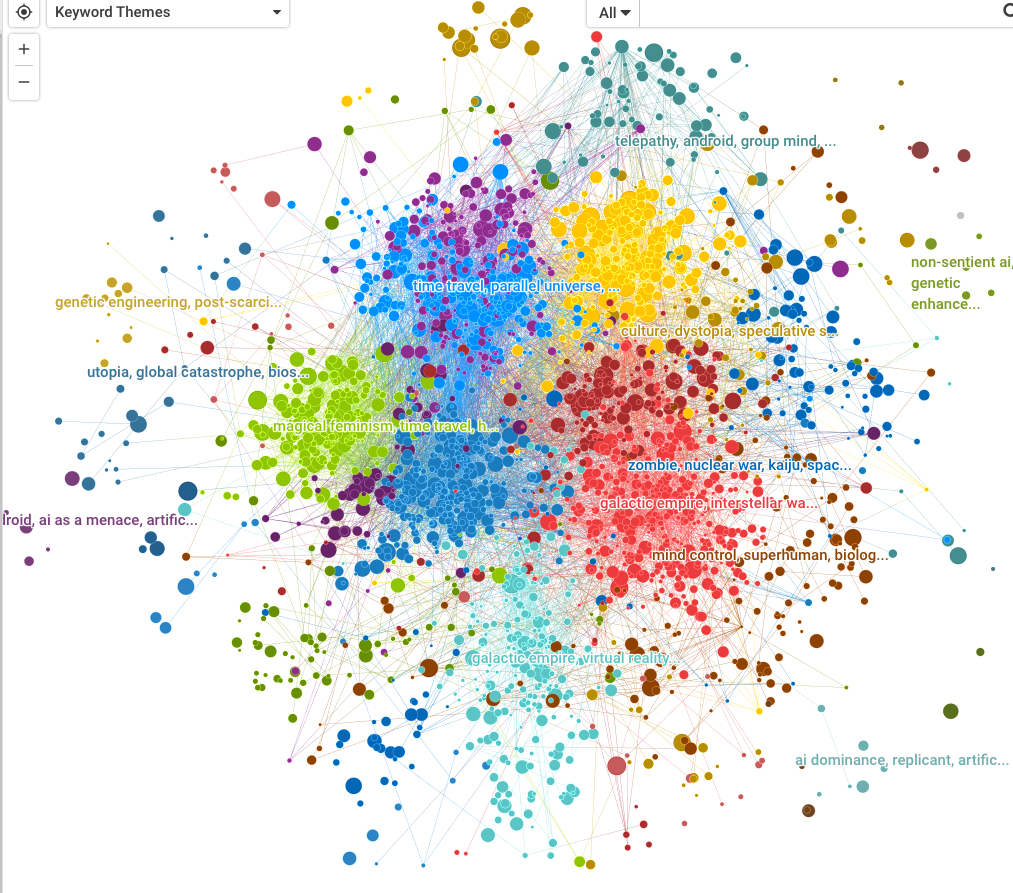
Questions, suggestions, and recommendations:
These are welcome and may be sent to Arielle Saiber: [email protected]
Copyright Information:
The information on this website is licensed under Creative Commons 4.0.
The images are © Franco Brambilla.
![]()