Turning Birdsong into Color Patterns
One of the most effective ways to turn sounds into visual images is the spectrogram (also known as sonogram). Spectrograms plot the frequency (pitch) of sound energy against time, much like a human musical score. Besides being scientifically useful, spectrograms produce intriguing and lovely patterns. I wonder, what aesthetic impression would a spectrogram have on a viewer if the sounds were converted into color patterns?
I explored this question by taking advantage of spectrograms of six different songs sung by a single male Song Sparrow (Melospiza melodia), a common Maine bird. All the songs, recorded and digitized by my colleague, Don Kroodsma, had a frequency range of 7 kHz (2-9 kHz).
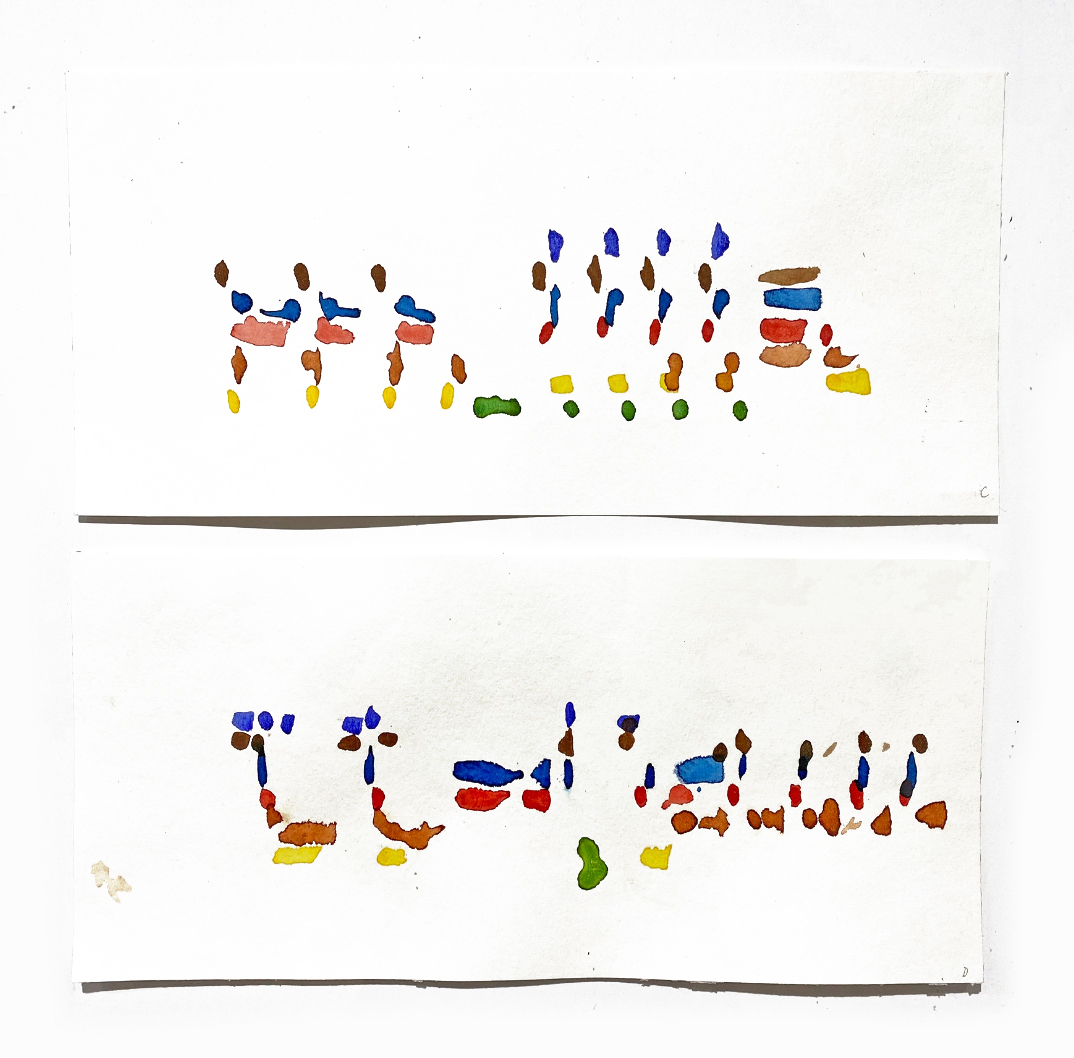
I randomly assigned a different watercolor to each of the seven 1-kHz bands. I then laid watercolor paper on a light table on top of each spectrogram. Working on one frequency band at a time, I applied just enough water to dampen the watercolor paper. Then, wherever a tracing appeared in that frequency band, I dropped one drop of the assigned watercolor from a height of one inch onto the watercolor paper, allowing colors to flow into each other.
After the watercolors had dried, I placed each spectrogram out in the rain for different amounts of time [0 (song C), 0.01 (D), 0.1 (E), 1 (F), 10 (G) and 100 (H) minutes], to allow the colors to run and fade.
For comparison with human music, I repeated the same procedure with the opening line of the songs “Twinkle, Twinkle, Little Star” and “The Star-Spangled Banner.”
Could it be that birds actually experience songs as color patterns?