Shifting Borders
In his book Dust Bowl: The Southern Plains in the 1930s, Donald Worster suggests that there exists a paradox surrounding how we geographically define the Dust Bowl: “The Dust Bowl was the darkest moment in the twentieth-century life of the southern plains. The name suggests a place—a region whose borders are as inexact and shifting as a sand dune. But it was also an event of national, even planetary, significance,” (Worster 2004, 4). Worster’s analysis speaks to a dualism related to the geography of the Dust Bowl. Although the event proved highly significant on a national scale, the geographic borders of the disaster remain remarkably unclear. This is noteworthy for many reasons, the simplest of which is probably the oddness of how one of the most basic pieces of information about a disaster—where it occurred—remains somewhat undefined for a crisis of such magnitude. Harry McDean likewise comments on this aspect of Dust Bowl historiography: “Even the most basic characteristic of the Dust Bowl—its geographic boundary—has two different compositions. The textbook writers locate the Dust Bowl in a variety of places where the Dust Bowl history books do not: in the Great Plains generally, or in states outside the Plains, or often anywhere that the dust blew in the thirties,” (McDean 1986, 1118). Given the fluid nature of the geography of the Dust Bowl, this page uses several maps to consider why the geography of the Dust Bowl is so amorphous, and how this quality impacts the overall history of the disaster.
Differential Metrics
One primary reason that the geography of the Dust Bowl remains so undefined is that there are several metrics that can be used to create maps of the event. These include wind erosion, drought, dust storms, crop failure, poverty, and human migration, among others. Although several of these metrics produce maps with significant areas of overlap, sometimes different metrics produce maps that differ significantly from one another. Further, creators may also fail to describe precisely what the cartography of a map illustrates (Porter and Finchum 2009, 201).
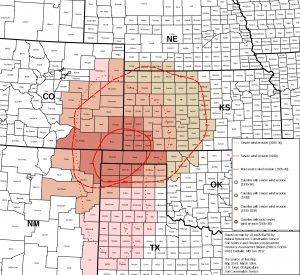
This map by the Soil Conservation Service illustrates areas of wind erosion in the years 1935-1938. It incorporates both rigid boundaries, as illustrated by the counties and red lines, as well fluid boundaries that show graduating levels of severity and temporal fluctuation. Based on the wind erosion metric, the epicenter of the Dust Bowl lies around the panhandle of Oklahoma. It also includes the northwest part of the Texas panhandle, the southwestern corner of Kansas, the southeastern corner of Colorado, and the northeastern corner of New Mexico. Because it was made by such a prominent government agency, this map is often evoked as an official record of the location of the Dust Bowl. The borders portrayed within it have also significantly influenced other major cartographical depictions (Porter and Finchum 2009, 202).
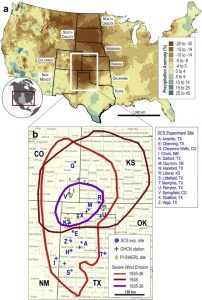
The above map notably employs two different metrics to describe the geography of the Dust Bowl: drought and wind erosion. The upper portion, which depicts precipitation anomalies in the years 1931-1940, suggests that the region around the Oklahoma panhandle was not unique in experiencing drought during these years. Rather, drought was a widespread phenomenon all across the U.S. during this time. In the lower section of the map, wind erosion is portrayed in a similar manner as to the Soil Conservation Service’s map. The result is that these images are nearly identical. However, adding in the additional metric of drought adds an additional layer of complexity to this map.
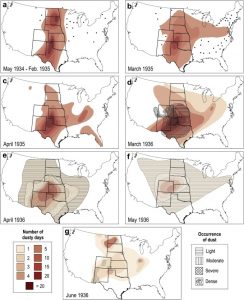
This final map takes a remarkably different approach from the two above. Here, specific months are highlighted as opposed to the longer timespans of the other maps. Further, only maps on a national scale are used. Perhaps most significantly, this map also represents a different metric: dust storms. Overall, this series of maps show an epicenter around the Oklahoma panhandle. However, dust storms also occurred in a broad range of other places both within and beyond the Great Plains. Further, the intensity of these storms varied significantly over the decade.
Beyond the Epicenter: A Gradient of Severity
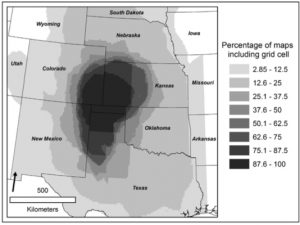
In one study, researchers compared the boundaries of twenty-three different published maps of the Dust Bowl (Porter and Finchum 2009, 203). Compiling the results into a single map yielded the result below. This cartography suggests both an epicenter around the Oklahoma panhandle, as well as radically diverging borders between the maps examined. Overall, this representation suggests another reason why the geography of the Dust Bowl remains unclear: using different thresholds of severity can produce stark differences between cartographies.
The Dust Bowl vs. the Great Plains: Confused Geographies
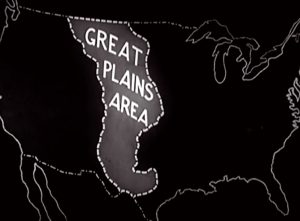
One final reason why maps of the Dust Bowl may look wildly different is that the Bust Bowl region is often conflated with the Great Plains. Although the two certainly overlap, the Great Plains cover a much larger region than what is generally considered the epicenter of the Dust Bowl. The map below, which is included in Pare Lorentz’s documentary The Plow that Broke the Plains, illustrates the Great Plains area. Yet the documentary itself focuses on the Dust Bowl, thus showing how confusion between these two ideas can manifest. It’s also noteworthy that the larger region covered by the Great Plains aligns with the government-sponsored narrative that Lorentz emphasizes in the film.
What can we learn from the amorphous geography of the Dust Bowl?
The geographic region of the Dust Bowl is not confined to one specific region. Rather, it extends inconsistently across the Great Plains and beyond depending on the metric used, or the source consulted. What can we learn from this? First, defining the borders of the Dust Bowl relies to a great extent on the metric, threshold of severity, and timescale used. Unique combinations of these factors combine to produce diverging stories. These stories and their respective maps might be used to further particular narratives, as was done in the Lorentz documentary, or they might highlight previously underrepresented aspects of the disaster, such as regions affected by a particular hardship. Regardless, understanding the geography of the Dust Bowl and the ways in which it varies helps us understand the multilayered nature of the event.
Image credits, in order of appearance:
- United States Soil Conservation Service.
- Bolles, Kasey, Mark Sweeney, and Steven Forman. 2019. “Meteorological Catalysts of Dust Events and Particle Source Dynamics of Affected Soils during the 1930s Dust Bowl Drought, Southern High Plains, USA.” Anthropocene 27 (September): 2.
- Bolles et al., 7.
-
Porter, Jess C, and G Allen Finchum. 2009. “Redefining the Dust Bowl Region via Popular Perception and Geotechnology.” Great Plains Research 19 (2): 5.
-
Lorentz, Pare. 1936. The Plow That Broke the Plains. United States Resettlement Administration.