
Focusing the Spectrometer
- The first step is to focus the eyepiece of the telescope sharply on the cross-hairs. This is the only adjustment which depends on the eyes of the individual observer. Once made, this adjustment should not be changed during the subsequent focusing steps. To do this, slip the piece of white paper in front of the telescope (this will help you see the cross-hairs). To focus, slide the eyepiece of the telescope in or out until the cross-hairs are sharply focused. Again, once made, this adjustment should not be changed during the subsequent focusing steps.
- The next step is done one group at a time with your Lab Instructor. Work on the proof while you wait! If you finish that, review these instructions and work on your lab notebook.
- One focuses the telescope by pointing it at a distant object – we will do this using the paper with the horizontal black line on it at the end of the landing (located on the door to lecture hall 315). Adjust the movable tube containing both the cross-hairs and the eyepiece until the horizontal black line and the letters “A B C” come sharply into focus and exhibit no parallax motion relative to the cross-hairs when you move your eye slightly from side-to-side. This ensures that parallel rays entering the telescope are focused on the cross-hairs. Now level the telescope so that the line on the sign lines up with the intersection of the cross-hairs.
- Next, on your lab bench, place the mercury lamp right in front of the slit located on the back end of the collimator. Make sure the mercury lamp and the slit are at the same height so all of the light enters the slit. Now point the telescope at the collimator and look through it and locate the illuminated slit. Level the collimator so that the image of the slit is centered on the cross-hairs. Cautiously move the piece containing the slit in or out of the collimator tube until the slit is sharply in focus. When the proper focus is obtained, slight irregularities will be seen on the edges of the slit, and there will be no parallax relative to the cross-hairs. Lastly adjust the width of the slit by rotating a knob or ring at the end of the collimator, depending on the model of the spectrometer. The slit should be made quite narrow, but allow enough light through for good visibility. Make sure the mercury lamp is still right against the slit.
Operating the Spectrometer
The spectrometers consist of a table, a collimator, and a telescope, each of which rotates with respect to the base, but can be fixed in place by tightening a radial clamping screw. The collimator is locked in place and should not be rotated for today’s Lab. The telescope can be rotated through small angles (when clamped) by using the slow motion (or tangent) screws. For this experiment you will leave the collimator clamped and will only need to move the table and the telescope, but please bear in mind:
Always move the telescope by pushing on its clamping screw. Never push on the telescope itself.
You should first examine the various clamps and the slow motion (or tangent) screws that control the relative rotations of the different parts of the spectrometer, discussing any questions with your lab instructor.
The spectrometer comes with two vernier scales (on opposite sides of the prism table) to indicate the position of the telescope. You may use either one. However once you have chosen which one you are going to use, you must always use that one for all of your measurements. The main scale of \(360\) degrees is graduated into half degrees, and the vernier reads directly in minutes \((60\:\rm{minutes} = 1\:\rm{degree}\)). To read the main scale, find the zero of the vernier scale. In general, this zero will not coincide precisely with a main scale division. Record the main scale division that lies nearest to but lower down on the main scale. This reading will be in degrees or degrees plus \(30’\). To that main scale reading, add the vernier reading indicated by that division of the vernier that best coincides with one of the main scale divisions. For a more detailed explanation, see the instructions on reading a vernier scale.
To measure a rotation angle it is necessary, of course, to take two readings. Usually the smaller is subtracted from the larger for a determination of the rotation angle. However, it may have happened that during the rotation the zero or \(360\) degree mark on the main scale has been passed by. Then, \(360\) degrees must be added to the smaller reading before subtracting. You should follow the motion of the telescope as it rotates to see if it passes through the \(360\) degree mark.
Measuring the Prism Angle
Do not put your fingers on the polished faces of the prism!
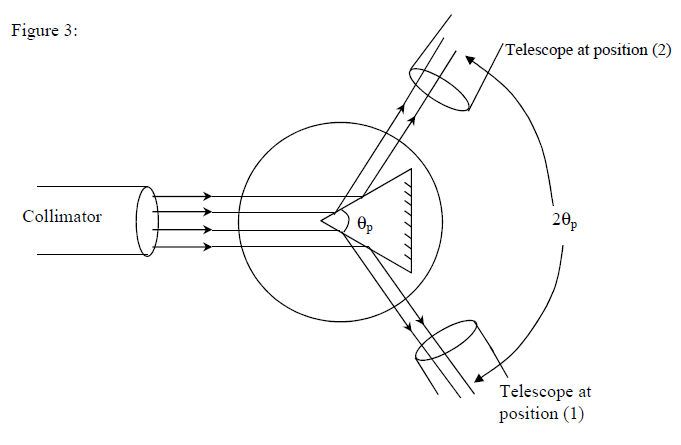
Record the letter that is written on the prism base. Place the prism on the prism table, as shown in Figure 3. Make sure that the prism rests securely on the ground base, with the refracting edge near the center of the table. Measure the angle of the prism, \(\theta_{p}\), as follows. Center the telescope cross-hairs on the reflected image of the slit as indicated by position \(1\), and read the scale. (When adjusting the position of the telescope using the tangent screw, always approach the line from the same direction, either the right or the left, to avoid mis-measurements due to backlash.) Detailed instructions on how to read a vernier scale are here. Then, rotate the telescope to position \(2\), again centering on the reflected image of the slit, and read the scale again. (Make sure that you read the same vernier scale in position \(2\) as you did in position \(1\).) The angle through which the telescope is turned is twice the prism angle. Report all angles in degrees and minutes. Check your answer with your lab instructor to make sure that you are adjusting and reading things correctly.
Make a carefully drawn diagram of the setup in Figure 3. Now draw a large prism below your diagram and use it to prove that the angle through which the telescope is turned is twice the prism angle. Hint: Extend the lines made by the incident light rays into the prism and use symmetry.
Measuring the Angle of Minimum Deviation
Next we want to determine the index of refraction for various wavelengths by measuring the angle of minimum deviation for each wavelength. The spectral lines to be measured are the brightest lines:
- Violet: \(404.7\) nm (the brighter of the two closely-spaced lines, if you see a double line)
- Blue: \(435.8\) nm
- Green: \(546.1\) nm
There is also a bright yellow pair that we will not be measuring. Other lines may also be visible, namely a very faint red line, a weak bluish-green line, and a fainter violet line.
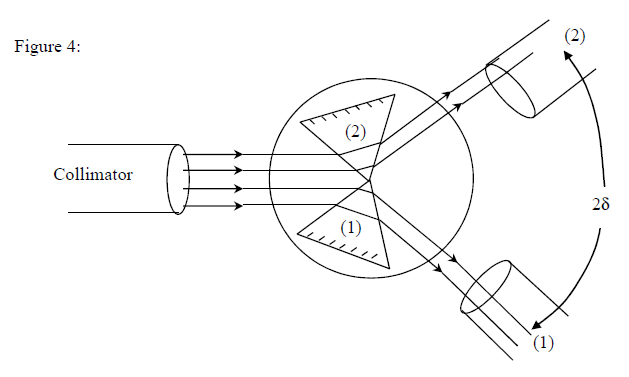
To find the angle of minimum deviation, the prism table should be left unclamped so that it is free to rotate. Set the prism at position \(1\) as shown in Figure 4. Do not touch or move the prism at any time once you establish its position on the table. Find the spectrum in the polished face of the prism with your naked eyes by moving your head until you see the spectral lines in the polished face of the prism. Swing the telescope into line and pick up these images in the eyepiece. Make sure that you see all the desired spectral lines through the telescope (which you may have to move in order to see the desired spectrum) before you begin.
As the prism table is turned, you will notice that these images move. Rotate the prism table so that the image moves in the direction of decreasing deviation (towards the red end of the spectrum). Follow the lines, keeping them in the field of view of the telescope. At a certain point, the lines will stop and then move in the opposite direction; this occurs at the angle of minimum deviation. It will be slightly different for each of the spectral lines. CLICK HERE TO SEE VIDEO Set the telescope crosshairs successively on each of the spectral lines position of minimum deviation and record the angular reading for each. Report all angles in degrees and minutes. Now rotate the prism table (again making sure not to touch or move the prism) so that the light is deviated in the other direction as shown in position \(2\) of Figure 4. Again measure the positions of minimum deviation for each of the spectral lines. Make sure you read the same vernier scale as you used for position \(1\), and note if you swing the telescope through the \(360\) degree mark between positions. The difference in the two measurements for each line is twice the angle of minimum deviation for that line. Report all angles in degrees and minutes.
Analysis
Using your three data points, compute the index of refraction for each wavelength (since we are not calculating uncertainty, carry your answers out to three decimal places). Make a graph of the index of refraction as a function of wavelength. Use an appropriate scale on each axis to best present the data. What can you conclude about the index of refraction by just looking at your graph (you do not need to add a trendline, error bars, etc.)?
Don’t forget the Summary Questions
Appendix: How to Use a Vernier Scale
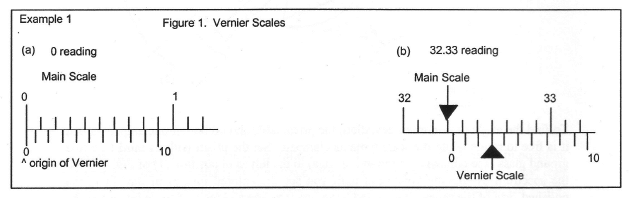
The scale in Appendix Figure 1 is calibrated so that each unit on the vernier scale corresponds to \(1/10^{\rm{th}}\) unit on the main scale of the actual measurement. The division (large tick) on the main scale in this example is \(1\) unit and each subdivision (small tick) is \(1/10^{\rm{th}}\) unit. That means that the division (large tick) on the vernier scale is \(1/10^{\rm{th}}\) unit and that each subdivision (small tick) is \(1/100^{\rm{th}}\) unit.
The reading from the main scale is taken at the point of the origin (\(0\)) of the vernier scale. Look along the main scale in Appendix Figure 1b and notice that the vernier scale’s zero index lines up somewhere between \(32.3\) and \(32.4\) on the main scale. On the main scale we cannot say more than the reading is \(32.3n\) where the added precision of the \(n\) digit will be given on the vernier scale.
We use the vernier scale to determine more precisely where we are between \(32.3\) and \(32.4\), to determine what \(n\) is in \(32.3n\). To determine this reading, look along the vernier scale until one of the vernier scale subdivisions lines up with one of the main subdivisions. That gives you the \(n\) value of \(3\) in Appendix Figure 1b. So our reading is \(32.33\). Notice that since the vernier subdivision is \(9/10\) the physical size of the main subdivision there will be only one place where a vernier subdivision lines up with a main subdivision.
The reading’s precision is half the least significant digit, which in this example is the hundredth digit, \(0.01\), so the precision is \(\pm 0.005\). We also call this our uncertainty. So we can record our reading to be \(32.330\pm 0.005\). This tells us that we cannot say our reading is exactly \(32.33\) for we are uncertain by \(\pm 0.005\). Our reading is somewhere between \(32.325\) and \(32.335\).
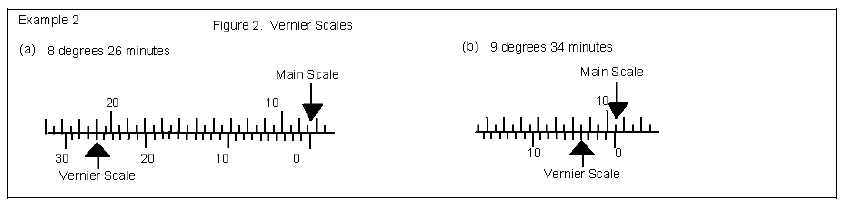
This second example is the vernier scale used in the prism index of refraction lab. We will use a spectrometer, which will measure degrees around a \(360\) degree circle. The main scale’s smallest unit is a half degree and the vernier scale’s smallest unit is a minute, which is \(1/60^{\rm{th}}\) of a degree – so there are \(60\) minutes per degree.
Like before, the origin (\(0\)) on the vernier scale points to the reading on the main scale in half degree resolution and the vernier scale is read where there is a line-up between tick marks on the two scales. In Appendix Figure 2a, the main scale reads between \(8\) and \(8.5\) degrees so it contributes \(8\) degrees, and the vernier scale reads \(26\) minutes, which gives us \(8\) degrees and \(26\) minutes or \(8.43\) degrees. In Appendix Figure 2b, the main scale reads between \(9.5\) and \(10\) degrees, so it contributes \(9.5\) degrees, which is \(9\) degrees \(30\) minutes, and the vernier scale adds \(4\) minutes to that, giving us \(9\) degrees and \(34\) minutes, or \(9.57\) degrees. The uncertainty is \(1/2\) a minute or approximately \(0.008\) degrees.
Background Equipment Summary Questions

