
Each lab group will collect data from one type of lamp: a tube light with an incandescent bulb or a CFL.
- If you have a tube light, start here.
- If you have a CFL, start here.
Incandescent Lamp Group Instructions
- Record the monochromator serial number.
- Verify that you have a working tube light with a clear incandescent bulb.
- Attach the fiber-optic cable to the entrance slit of the monochromator. Use one or more clamps to point the free end of the fiber-optic cable at the bulb making sure to that it lines up with the center of the bulb and that it is about a centimeter away from the end of the bulb.
- Look straight into the exit slit of the monochromator – to do this this, carefully pick up the monochromator and look into the exit slit (using it in this mode always reminds me of playing with a View-Master). Record your observations as you dial in different wavelengths from slightly below 400 nm to to slightly above 800 nm. Answer the following questions:
- Does the spectrum appear to be continuous or discrete?
- Which colors do you see? Record the wavelengths for three of these colors.
- Are some colors brighter than others? Which ones?
- Build the circuit consisting of the photodiode/amplifier, power supply, and DMM.
- Connect the photodiode/amplifier to the exit slit of the monochromator. Set the DMM range to 4V DC. Please ask the lab instructor to check the wiring before you turn on the power supply.
- Turn on the power supply. There are several things to consider to ensure that the data you take will be meaningful and easy to interpret:
- Back the fiber-optic cable away from the bulb so you can block the light entering the cable with your thumb. What voltage output do you read on the DMM when you block the light input to the fiber-optic cable? What should it be? Adjust your set up accordingly (see Lab Instructor if you need clarification or help in deciding what and/or how you should adjust your set up.
- What is the magnitude of the largest voltage (without uncertainty) that can be measured? To do this, set your DMM to the 40 DC Volt range. Disconnect the photodiode/amplifier from the monochromator and point the photodiode/amplifier’s input slot at your desk lamp making sure that the slot is as close to the bulb as possible. Why does this limit exist? Why do we want to avoid encountering it in normal operation?
- Amplifiers are most easily used when their output is linearly related to their input, and our analysis today will assume linear operation. The previous question concerned an example of an extreme nonlinearity which we will not encounter today. However it is Laboratory Best Practice to always know the limitations of the equipment one is using to make measurements. Always make sure that the range of measurements an instrument can make is compatible with the range that needs to be measured.
- Re-attach the photodiode/amplifier to the monochromator and re-position the fiber-optic cable so that the free end points at the bulb making sure to that it lines up with the center of the bulb and that it is about a centimeter away from the end of the bulb. Make sure your DMM is set back to the 4 DC Volt range. When you are ready to collect data, measure the output voltage as a function of wavelength every 10 nm from 460 nm to 800 nm. You should organize this data in a large table, leaving room for several additional columns.
- Using the information provided for our photodiode/amplifier and the monochromator’s diffraction grating, add correction factors to your table to account for the responsivity of the photodiode and the efficiency of the diffraction grating.
- Calculate the corrected power (without uncertainty) detected as a function of wavelength and record this in the last column of your table (Don’t forget to show sample calculations). Plot this power vs. wavelength spectrum. How does it compare to the solar spectrum?
- The wavelength at which the bulb’s power output peaks is related to the temperature of the filament by Wien’s Law: $$ \lambda_{\rm{max}}T=2.9\times 10^{-3}\rm{m\:K}. $$ Based on your plot, calculate the temperature of the filament of your bulb at its $ \lambda_{\rm{max}}$?
Now, pair up with a CFL group and answer these questions together.
CFL Group Instructions
- Record the monochromator serial number.
- Verify that you have a working CFL and record the color temperature marked on the lamp.
- Attach the fiber-optic cable to the entrance slit of the monochromator. Use one or more clamps to point the free end of the fiber-optic cable at the bulb making sure to that it lines up with the center of the bulb and that it is about five centimeters away from the end of the bulb.
- Look straight into the exit slit of the monochromator – to do this this, carefully pick up the monochromator and look into the exit slit (using it in this mode always reminds me of playing with a View-Master). Record your observations as you dial in different wavelengths from slightly below 400 nm to to slightly above 800 nm. Answer the following questions:
- Does the spectrum appear to be continuous or discrete?
- Which colors do you see? Record the wavelengths for three of these colors.
- Are some colors brighter than others? Which ones?
- Build the circuit consisting of the photodiode/amplifier, power supply, and DMM.
- Connect the photodiode/amplifier to the exit slit of the monochromator. Set the DMM range to 4V DC. Please ask the lab instructor to check the wiring before you turn on the power supply.
- Turn on the power supply. There are several things to consider to increase the odds that the data you take will be meaningful and easy to interpret:
- Back the fiber-optic cable away from the bulb so you can block the light entering the cable with your thumb. What voltage output do you read on the DMM when you block the light input to the fiber-optic cable? What should it be? Adjust your set up accordingly (see Lab Instructor if you need clarification or help in deciding what and/or how you should adjust your set up.
- What is the magnitude of the largest voltage (without uncertainty) that can be measured? To do this, set your DMM to measure on the 40 DC Volt range. Disconnect the photodiode/amplifier from the monochromator and point the photodiode/amplifier’s input slot at your desk lamp making sure that the slot is as close to the bulb as possible. Why does this limit exist? Why do we want to avoid encountering it in normal operation?
- Amplifiers are most easily used when their output is linearly related to their input, and our analysis today will assume linear operation. The previous question concerned an example of an extreme nonlinearity which we will not encounter today. However it is Laboratory Best Practice to always know the limitations of the equipment one is using to make measurements. Always make sure that the range of measurements an instrument can make is compatible with the range that needs to be measured.
- Re-attach the photodiode/amplifier to the monochromator and re-position the fiber-optic cable so that the free end points at the bulb making sure to that it lines up with the center of the bulb and that it is about five centimeters away from the end of the bulb. Make sure your DMM is set back to the 4 DC Volt range. When you are ready to collect data, measure the output voltage as a function of wavelength every 10 nm from 460 nm to 800 nm. You should organize this data in a large table, leaving room for several additional columns.
- Using the information provided for our photodiode/amplifier and the monochromator’s diffraction grating, add correction factors to your table to account for the responsivity of the photodiode and the efficiency of the diffraction grating.
- Calculate the corrected power (without uncertainty) detected as a function of wavelength and record this in the last column of your table (Don’t forget to show sample calculations). Plot this power vs. wavelength spectrum. Label the power spikes associated with the mercury spectrum . How does the CFL spectrum compare to the solar spectrum?
Now, pair up with an incandescent lamp group and answer these questions together.
Instructions for Both Groups
After collecting and analyzing data for your bulb, pair up with a lab group with the other type of bulb to answer these questions:
- Compare and contrast the two spectra. Consider the overall appearance of each. At which end of the spectrum does each emit the largest average detected power (ignoring the power spikes of the CFL lamp) ?
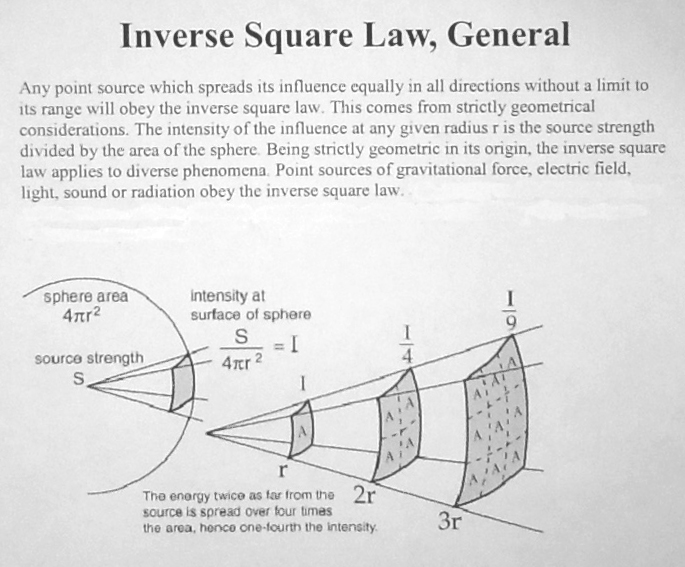
- How would you combine light from the two sources to “roughly” mimic the solar spectrum (in other words to achieve roughly the same intensity for all wavelengths between 460 and 800 nm (again ignoring the power spikes of the CFL lamp)? Should the lamps be at the same distance from the goldfish? It is possible to calculate these distances and you should do so (without uncertainty). Think Inverse Square Law.
- A very nice way to combine the two beams into one beam is to use a 50/50 filter or beam splitter which transmits half of the light hitting it and reflects the other half. Look at the corresponding demo in lab. Using it as a guide, draw a diagram showing an arrangement of the beam splitter, lamps, and fish that facilitates combining your CFL and Incandescent bulbs into one beam that achieves roughly the same intensity level for all wavelengths between 460 and 800 nm. Make sure to label the appropriate distances and bulbs.
Don’t leave without answering the Summary Questions!
Background Equipment Summary Questions
![]()
