
Partially drawn from C.G. Deacon’s “Error Analysis in the Introductory Physics Lab” in The Physics Teacher Vol. 30, Sept. 1992.
A Linear Graph
Equation
Remember the equation of a straight line? $$ y = m x + b$$ Most laboratory data can be plotted on a straight-line (linear) graph, where the slope \(m\) and the \(y\)-axis intercept \(b\) give physically meaningful results. When plotting points, the uncertainties associated with the data are also transferred to the graph, by the size of the error bars (in one or both axes).
Determining the slope…
Use your judgment to draw the best-fit straight line through the data points. Determine two points on this line – not data points unless they are exactly on the line – which are far apart, but easy to read. Grid points are best. Calculate the slope from these two points as $$m = \frac{\rm{rise}}{\rm{run}} = \frac{y_{2}-y_{1}}{x_{2}-x_{1}}.$$ Note that the greater the distance between your two points, the more accurate you will be since any error in reading point values will be less significant over a larger length.
…and its uncertainty
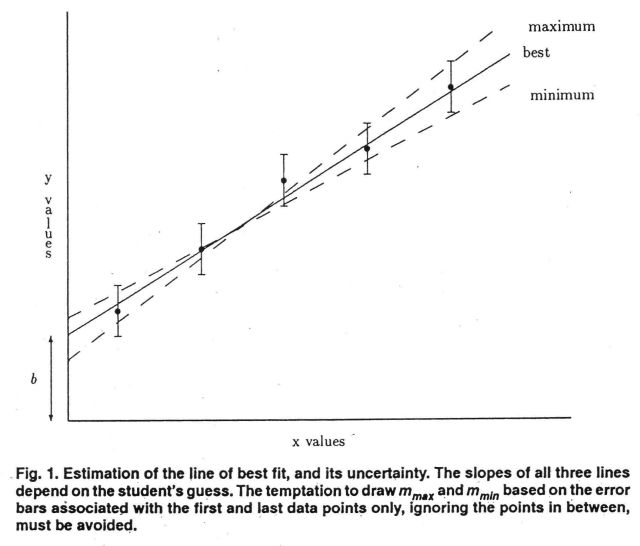
The uncertainty in the slope \(\delta m\) is estimated by considering extremes of maximum and minimum slope that might conceivably fit the data (see the figure). Sometimes we’ll call these lines “worst-fit lines”. Denoting the slopes of these lines by \(m_{\rm{max}}\) and \(m_{\rm{min}}\) respectively, \(\delta m\) may be calculated from $$\delta m = \frac{|m_{\rm{max}}-m_{\rm{min}}|}{2} .$$
Determining the intercept…
Read the \(y\)-intercept \(b\) directly from the graph. This is easy and is more accurate than a calculation, which depends on the accuracy of your calculated slope value and the \(x\),\(y\) values of a point you choose on the line. The \(y\)-intercept \(b\) is defined to be where the line crosses the \(y\)-axis.
…and its uncertainty
Similar to the uncertainty in the slope, the uncertainty in the \(y\)-intercept \(b\) is calculated using $$\delta b = \frac{|b_{\rm{min}}-b_{\rm{max}}|}{2}.$$
![]()
