
- We will be using four LED’s:
-
-
- red \(625\) \({\rm nm}\)
- yellow \(590\) \({\rm nm}\)
- green \(520\) \({\rm nm}\)
- blue \(460\) \({\rm nm}\)
-
-
- Set up the circuit and the DMM as shown below using two batteries in series, the potentiometer, the 220 ohm resistor, and one of the LEDs (the longer lead on the LED is the positive side). Do not connect the alligator clip lead to the negative terminal of the Batteries just yet (i.e. do not complete the circuit).
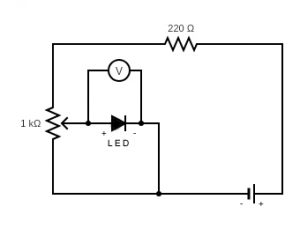
- Make sure the potentiometer is in the “zero” position by rotating its knob counter-clockwise until it stops moving.
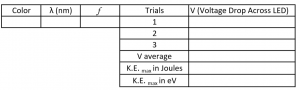
- Set up a data table for each of the four LED’s as follows:
- The following should be done in dim light/darkness.
- Set the DMM to the 4 V Range. Connect the alligator clip to the negative side of the Batteries to complete the circuit. Slowly rotate the knob on the potentiometer clockwise until the LED just begins to emit light. Make sure that you are truly at the spot where the LED just begins to emit light. When you are confident that you are, record the Voltage drop across it (\(V\)) in the data table. Rotate the knob on the potentiometer counter-clockwise back to its “zero” position. Repeat the above procedure two more times.
- Repeat the above process with each of the remaining three LED’s.
- Now go back and fill in your data tables by calculating \( f (frequency)\), \(V average\), \(K.E._{\rm{max}}\) \(in\) \(\rm{Joules}\) (using \(V average\)), and \(K.E._{\rm{max}}\) \(in\) \(\rm{eV}\). Don’t forget to show sample calculations. We will not be calculating uncertainty in this Lab, so round all values to three decimal places.
- Some useful information.
-
- \(q\) = \(1.60\times 10^{-19}\:\rm{C}\) charge of a single electron
- \(K.E._{\rm{max}}\) = \(q\)\(V\)
- \(1\) \(eV\) = \(1.60\times 10^{-19}\:\rm{J}\)
- \(speed\) \(of\) \(light\) = \(3.0\times 10^{8}\:\rm{m/s}\)
- \(f\) = \(speed\) \(of\) \(light\)\(/\) \(\lambda\)
-
- Plot your values of \(K.E._{\rm{max}}\) in \(\rm{eV}\) versus the frequency of the light. Do not truncate your axis.
- Use straight line analysis to determine a value for Planck’s constant (correlate the key equation with the equation of your line). We are not calculating the uncertainty, so error bars and worst fit lines are not needed. If you use Excel to plot your data and to calculate the equation of the best fit line (trendline), have it display the equation of the line with three significant figures to the right of the decimal point for both the slope and y-intercept.
- Compare your value for Planck’s constant to the accepted value of \(4.14\times 10^{-15}\:\rm{eV}\cdot\rm{s}\).
- What is the approximate value of the amount of energy transferred into heat (\(\phi\)) by each LED?
![]()
