
Part 1: Qualitative Observations of Series and Parallel Resistance
A battery stores chemical energy and produces a voltage difference across its terminals. If the \(+\) and \(-\) terminals are connected in a closed circuit, then this voltage drives a current through the circuit. If the charge carriers in the current leave the battery with a certain electrical potential energy, \(U\), they return to the battery with lowered \(U\), having dissipated the difference into other forms (thermal energy, light, sound) in the components of the circuit. In our circuits with a light bulb and carbon resistors the chemical energy of the battery is ultimately converted into thermal energy. Note that a tungsten light bulb is effectively a resistor that gets so hot it emits radiation in the visible spectrum. The brightness of the emitted light depends on the rate at which energy is dissipated in the filament, a quantity known as the electrical power, which is the product of the voltage and current: \(P=VI\).
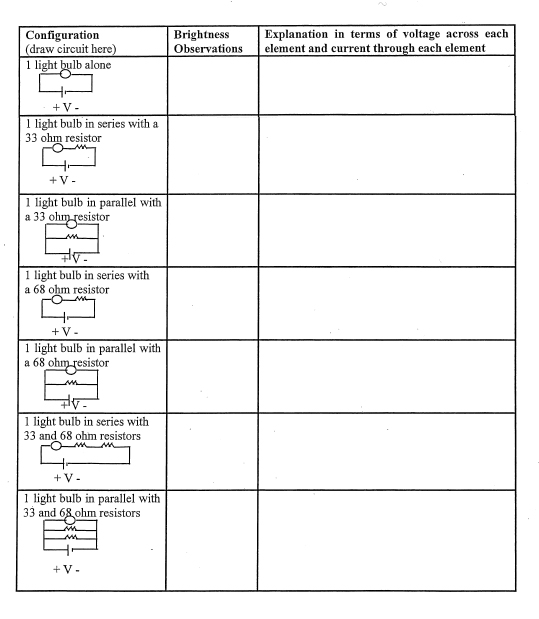
You will set up the following circuits with two \(1.5\:\rm{V}\) batteries connected in series to produce an approximate \(3.0\:\rm{V}\) source. Use the smaller light bulb that came in your In Lab Kit. This exercise we will not be measuring voltage nor current and thus not calculating the power dissipated by the bulb. Instead you will give qualitative comparisons of how bulb brightness differs between configurations. Think about how you want to qualify the brightness. You may use terms like brightest, very bright, dim, etc. How you qualify the brightness is up to you. Then try to explain why you think the bulb is bright or dim in terms of the relative amount of voltage drop across and the relative amount of current through each of the elements in each circuit. Record your observations and explanations in the table below (this table is reproduced in the “Write-Up Template”). WARNING: The carbon resistors and light bulb may get very hot when the circuit is energized. Do not touch them. Use their leads to connect and disconnect them.
Part 2: Quantitative Verification of Ohm’s Law
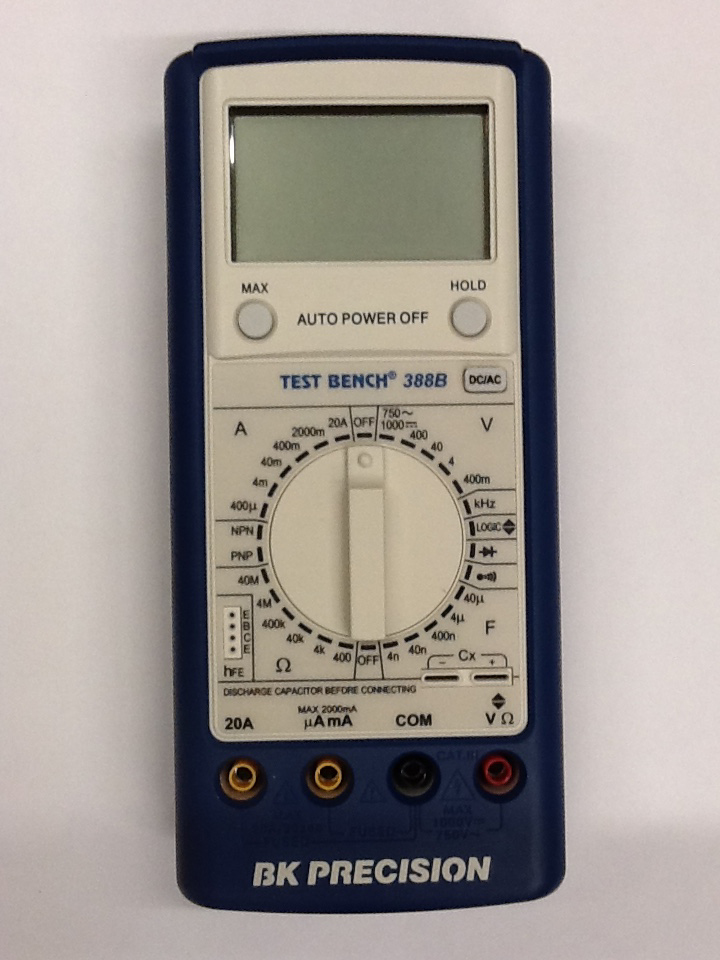
Ohm’s Law, \(V=IR\), (\(V\propto I\), where the proportionality constant is a constant resistance \(R\)), holds for devices whose resistance is independent of current. Such a device is said to be “ohmic”. It is also said to be “linear” since the voltage across it is linearly related to the current flowing through it by its resistance value. You will examine this relationship for the \(10\:\Omega\) ceramic resistor by creating \(four\) different circuits. The first circuit will consist of a single battery and the resistor wired in series. For each additional circuit, add another battery in series to the previous circuit. For each circuit use the BK PRECISION DMM (Digital Multi-Meter) to measure the voltage drop across the resistor. Then use the BK PRECISION DMM (Digital Multi-Meter) to measure the current flowing through the resistor for each circuit. Make sure that you record which range setting you are using for each of your measurements. WARNING: The ceramic resistor may get very hot when the circuit is energized. Do not touch it. Use its leads to connect and disconnect it.
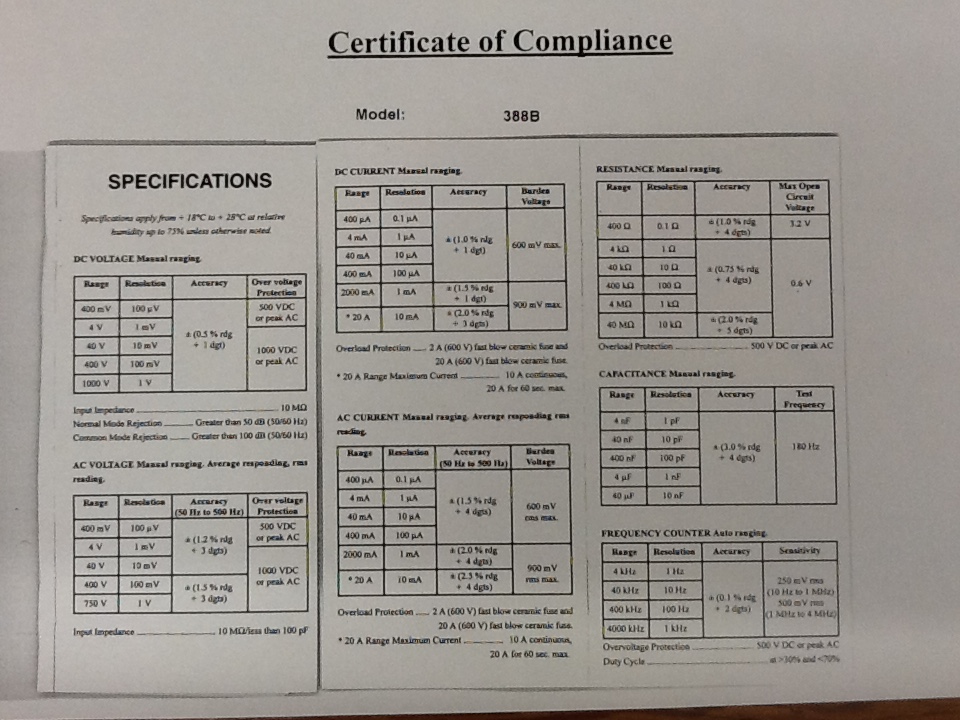
The uncertainty of the meters for each range is given by the manufacturer’s “specs” in the operator’s manual. Look up the appropriate uncertainty formulas and record them. You will be using them to find \(\delta V\) and \(\delta I\) for each measurement you take!
Record your data a table set up similarly to the one below:
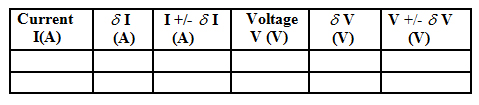
One Battery Two Batteries etc.
Plot \(V\) vs. \(I\). You may use EXCEL to make your plot, or you may plot by hand. If your uncertainties are too small to plot as error bars, make a note on the plot stating so.
Calculate the resistor’s value with uncertainty by using Straight Line Analysis. Compare the equation of your line to the expected relationship \(V=IR\) (Key Equation). It should be apparent that you should force your best fit line through 0,0 because if there is no voltage, there can be no current. Make sure you show how the equation of your line relates to the Key equation. Now calculate the uncertainty of the resistor’s value using worst fit lines. Note: If your uncertainties were too small to plot as error bars, you will have to calculate the slopes of the upper worst and lower worst fit lines using the mathematical method.
Measure the \(10\:\Omega\) resistor’s resistance using your multimeter (note that the resistor must be removed from the circuit in order to measure its resistance with the meter). Calculate this measurement’s uncertainty using the manufacturer’s uncertainty specification (multimeter manual). Compare your calculated resistance from above to the measured resistance. Are they equal within uncertainty?
Part 3: Quantitative Study of Non-Ohmic Behavior of a Light Bulb
In this section we will measure the resistance of the tungsten filament in the larger light bulb that came in your Lab Kit. This device is non-ohmic since R is not constant. The resistance in non-ohmic devices changes as a function of current – in this case due to the increase in temperature with increasing current.
Use the same procedure that you followed in Part 2, except this time use the larger light bulb in the circuit instead of the resistor. Just as you did with the resistor in Part 2, build the four different circuits and use the BK PRECISION DMM (Digital Multi-Meter) to measure the voltage drop across the light bulb and the current through the light bulb for each circuit. Make sure that you record which range setting you are using for each of your measurements. WARNING: The light bulb may get very hot when the circuit is energized. Do not touch it. Use its leads to connect and disconnect it.
Create a table similar to the one you used in Part 2, but this time add columns for Resistance (calculated by V/I) and its uncertainty (refer to the error propagation rules sheet available on Blackboard or refer to the error propagation rules in the manual if necessary). You will then make two plots: one of voltage versus current to obtain the “characteristic curve”* of the light bulb, and another of resistance versus current to see how resistance changes with current. You do not need to put error bars on these two plots. *Note: You are not doing straight line analysis for this Lab because your plots are not linear.
Extrapolate the light bulb resistance at room temperature (when current is zero) from your graph . Compare the extrapolated light bulb resistance to that read using the DMM on its ohm scale. Comment on the agreement of your two values.
Background Equipment Summary Questions

